Monitoring
Available as of v0.3.0
Dashboard Metrics
Harvester v0.3.0 has provided a built-in monitoring integration using Prometheus. Monitoring is automatically installed during ISO installations.
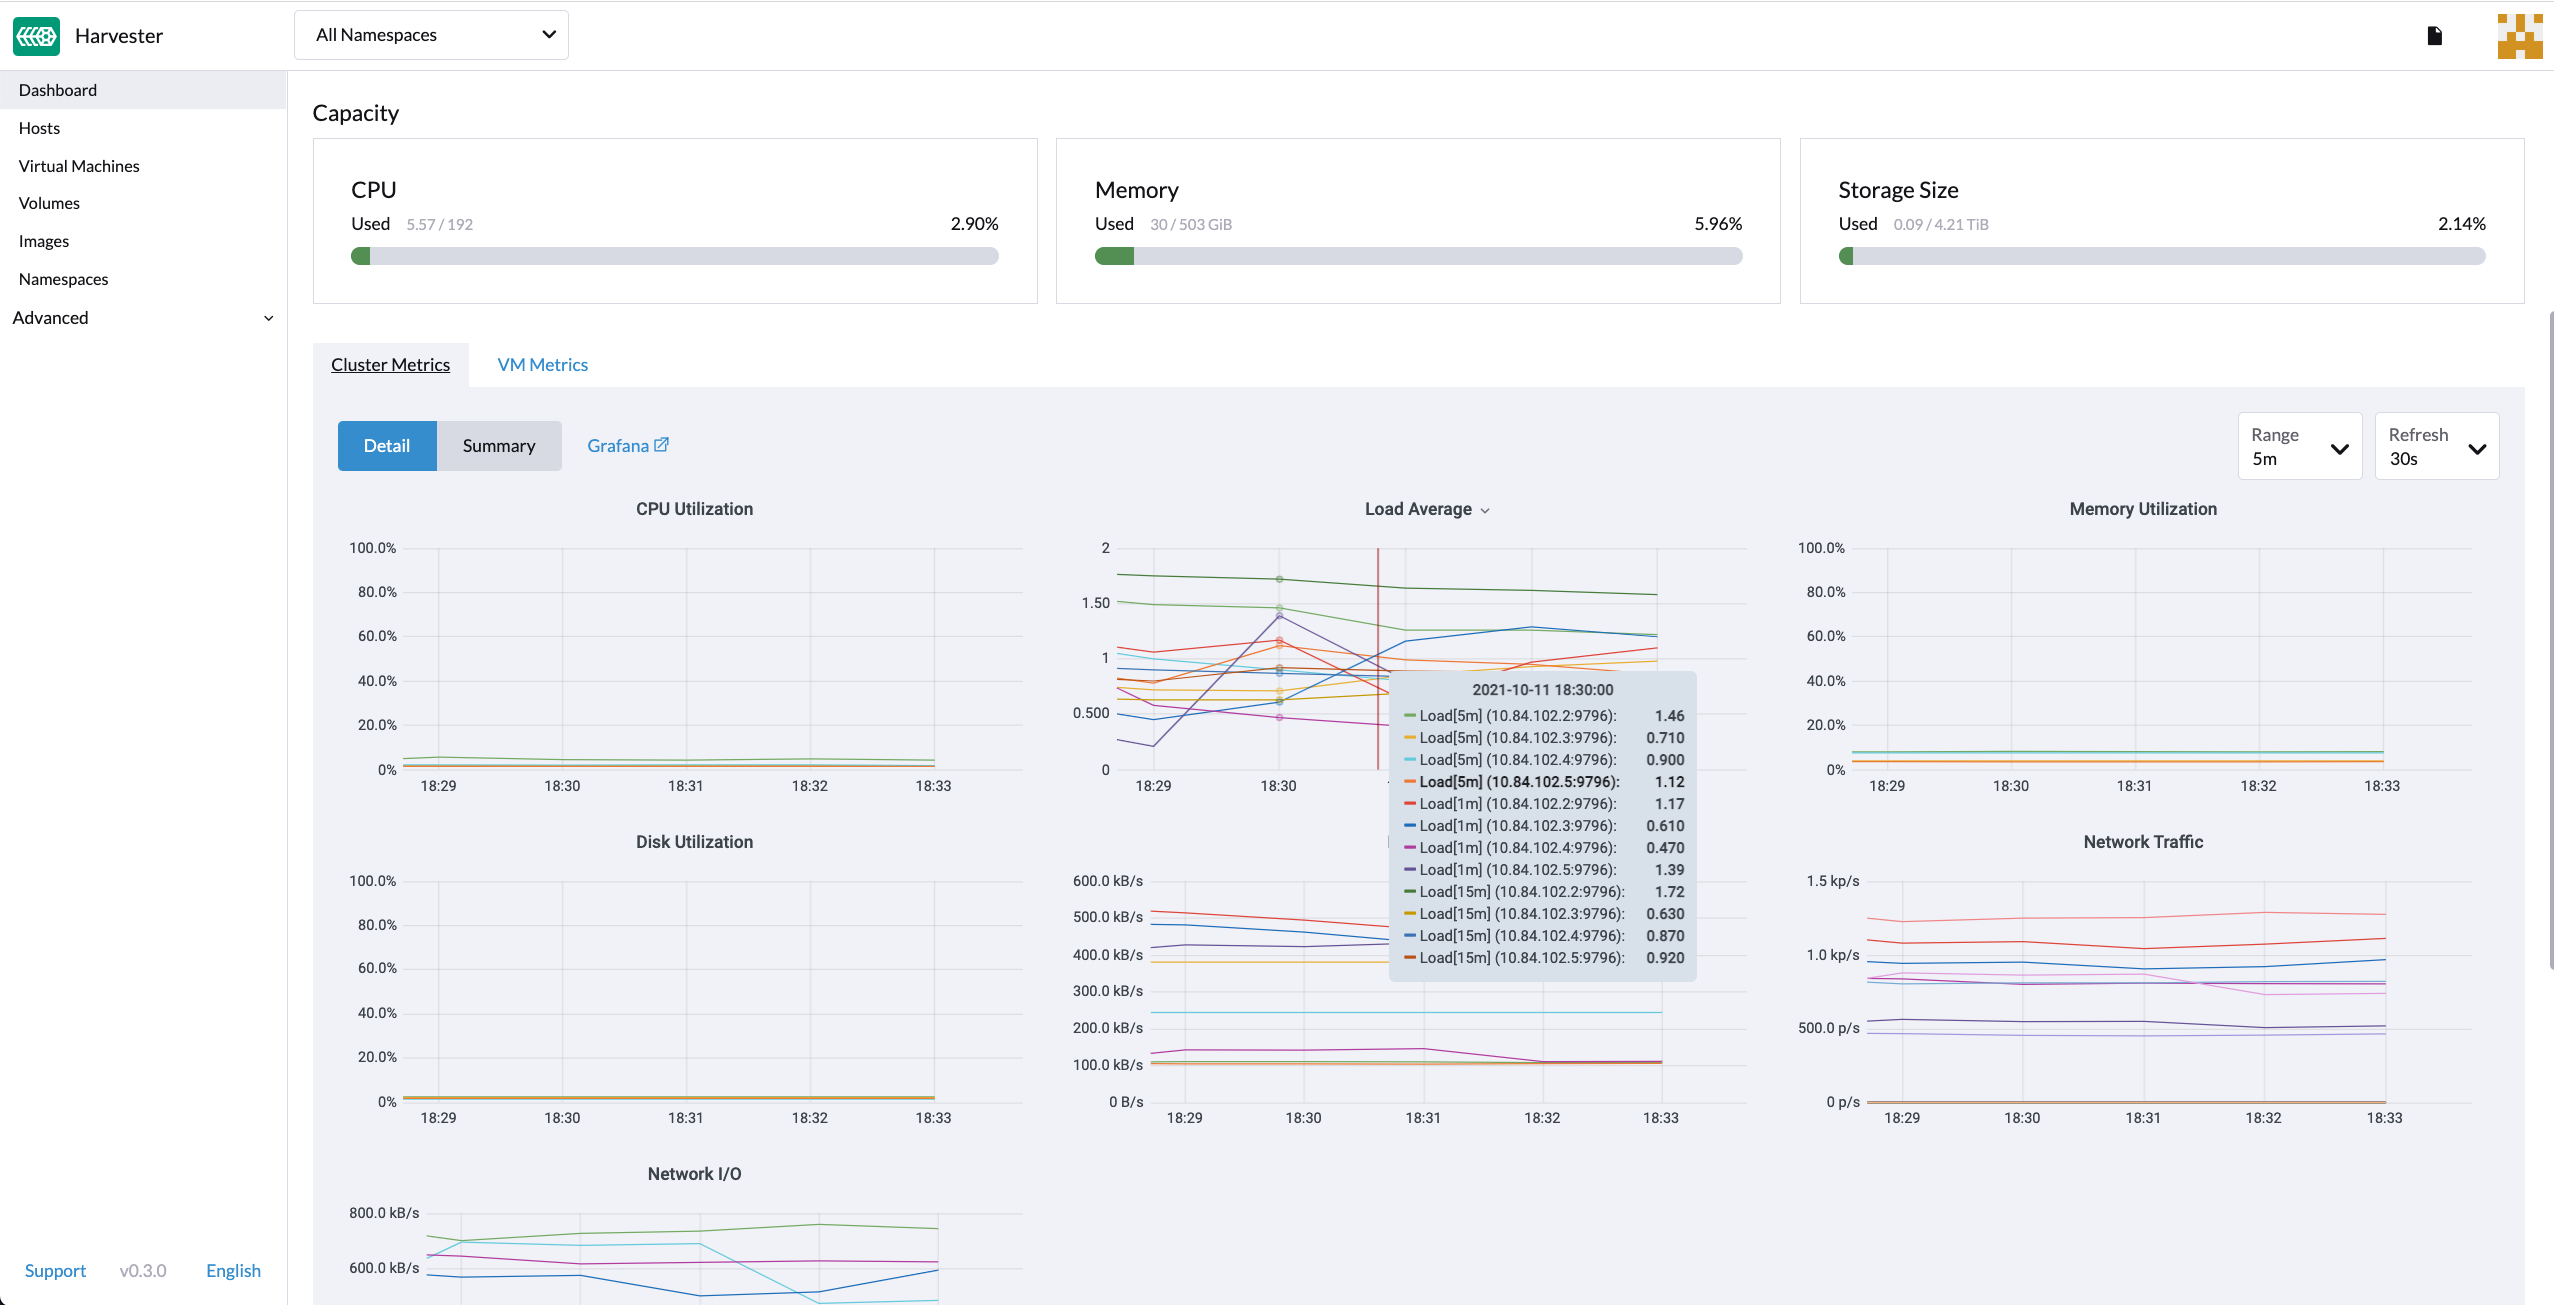
From the Dashboard page, users can view the cluster metrics and top 10 most used VM metrics respectively.
Also, users can click the Grafana dashboard link to view more dashboard on the Grafana UI.
note
Only admin users are able to view the dashboard metrics.
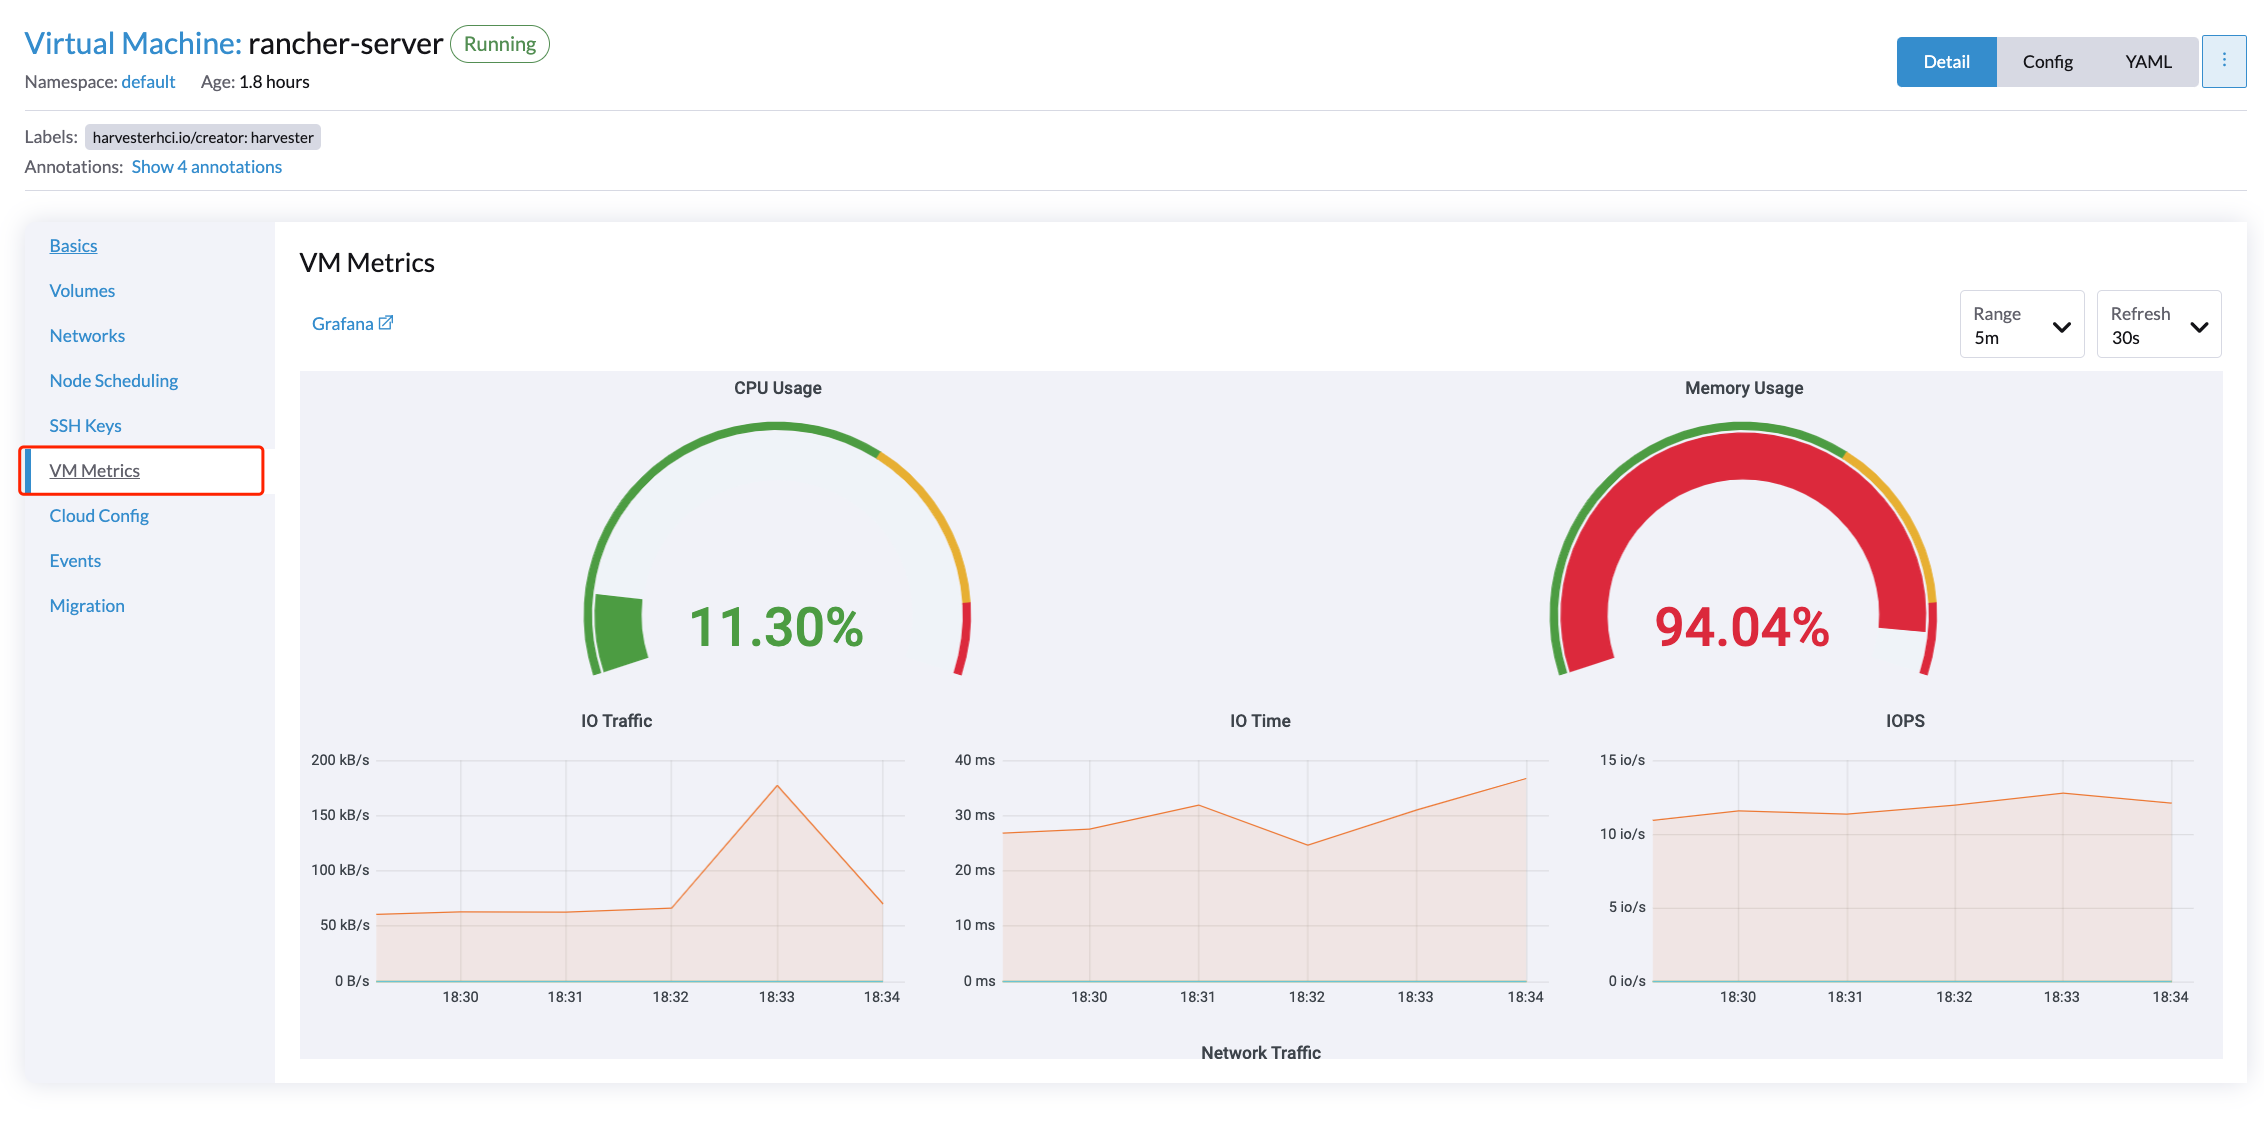
VM Detail Metrics
For each VM, users can view the VM metrics by clicking the VM details page.