Monitoring
Available as of v0.3.0
Dashboard Metrics
Harvester has provided a built-in monitoring integration using Prometheus. Monitoring is automatically enabled during the Harvester installations.
From the Dashboard page, users can view the cluster metrics and top 10 most used VM metrics respectively.
Also, users can click the Grafana dashboard link to view more dashboards on the Grafana UI.
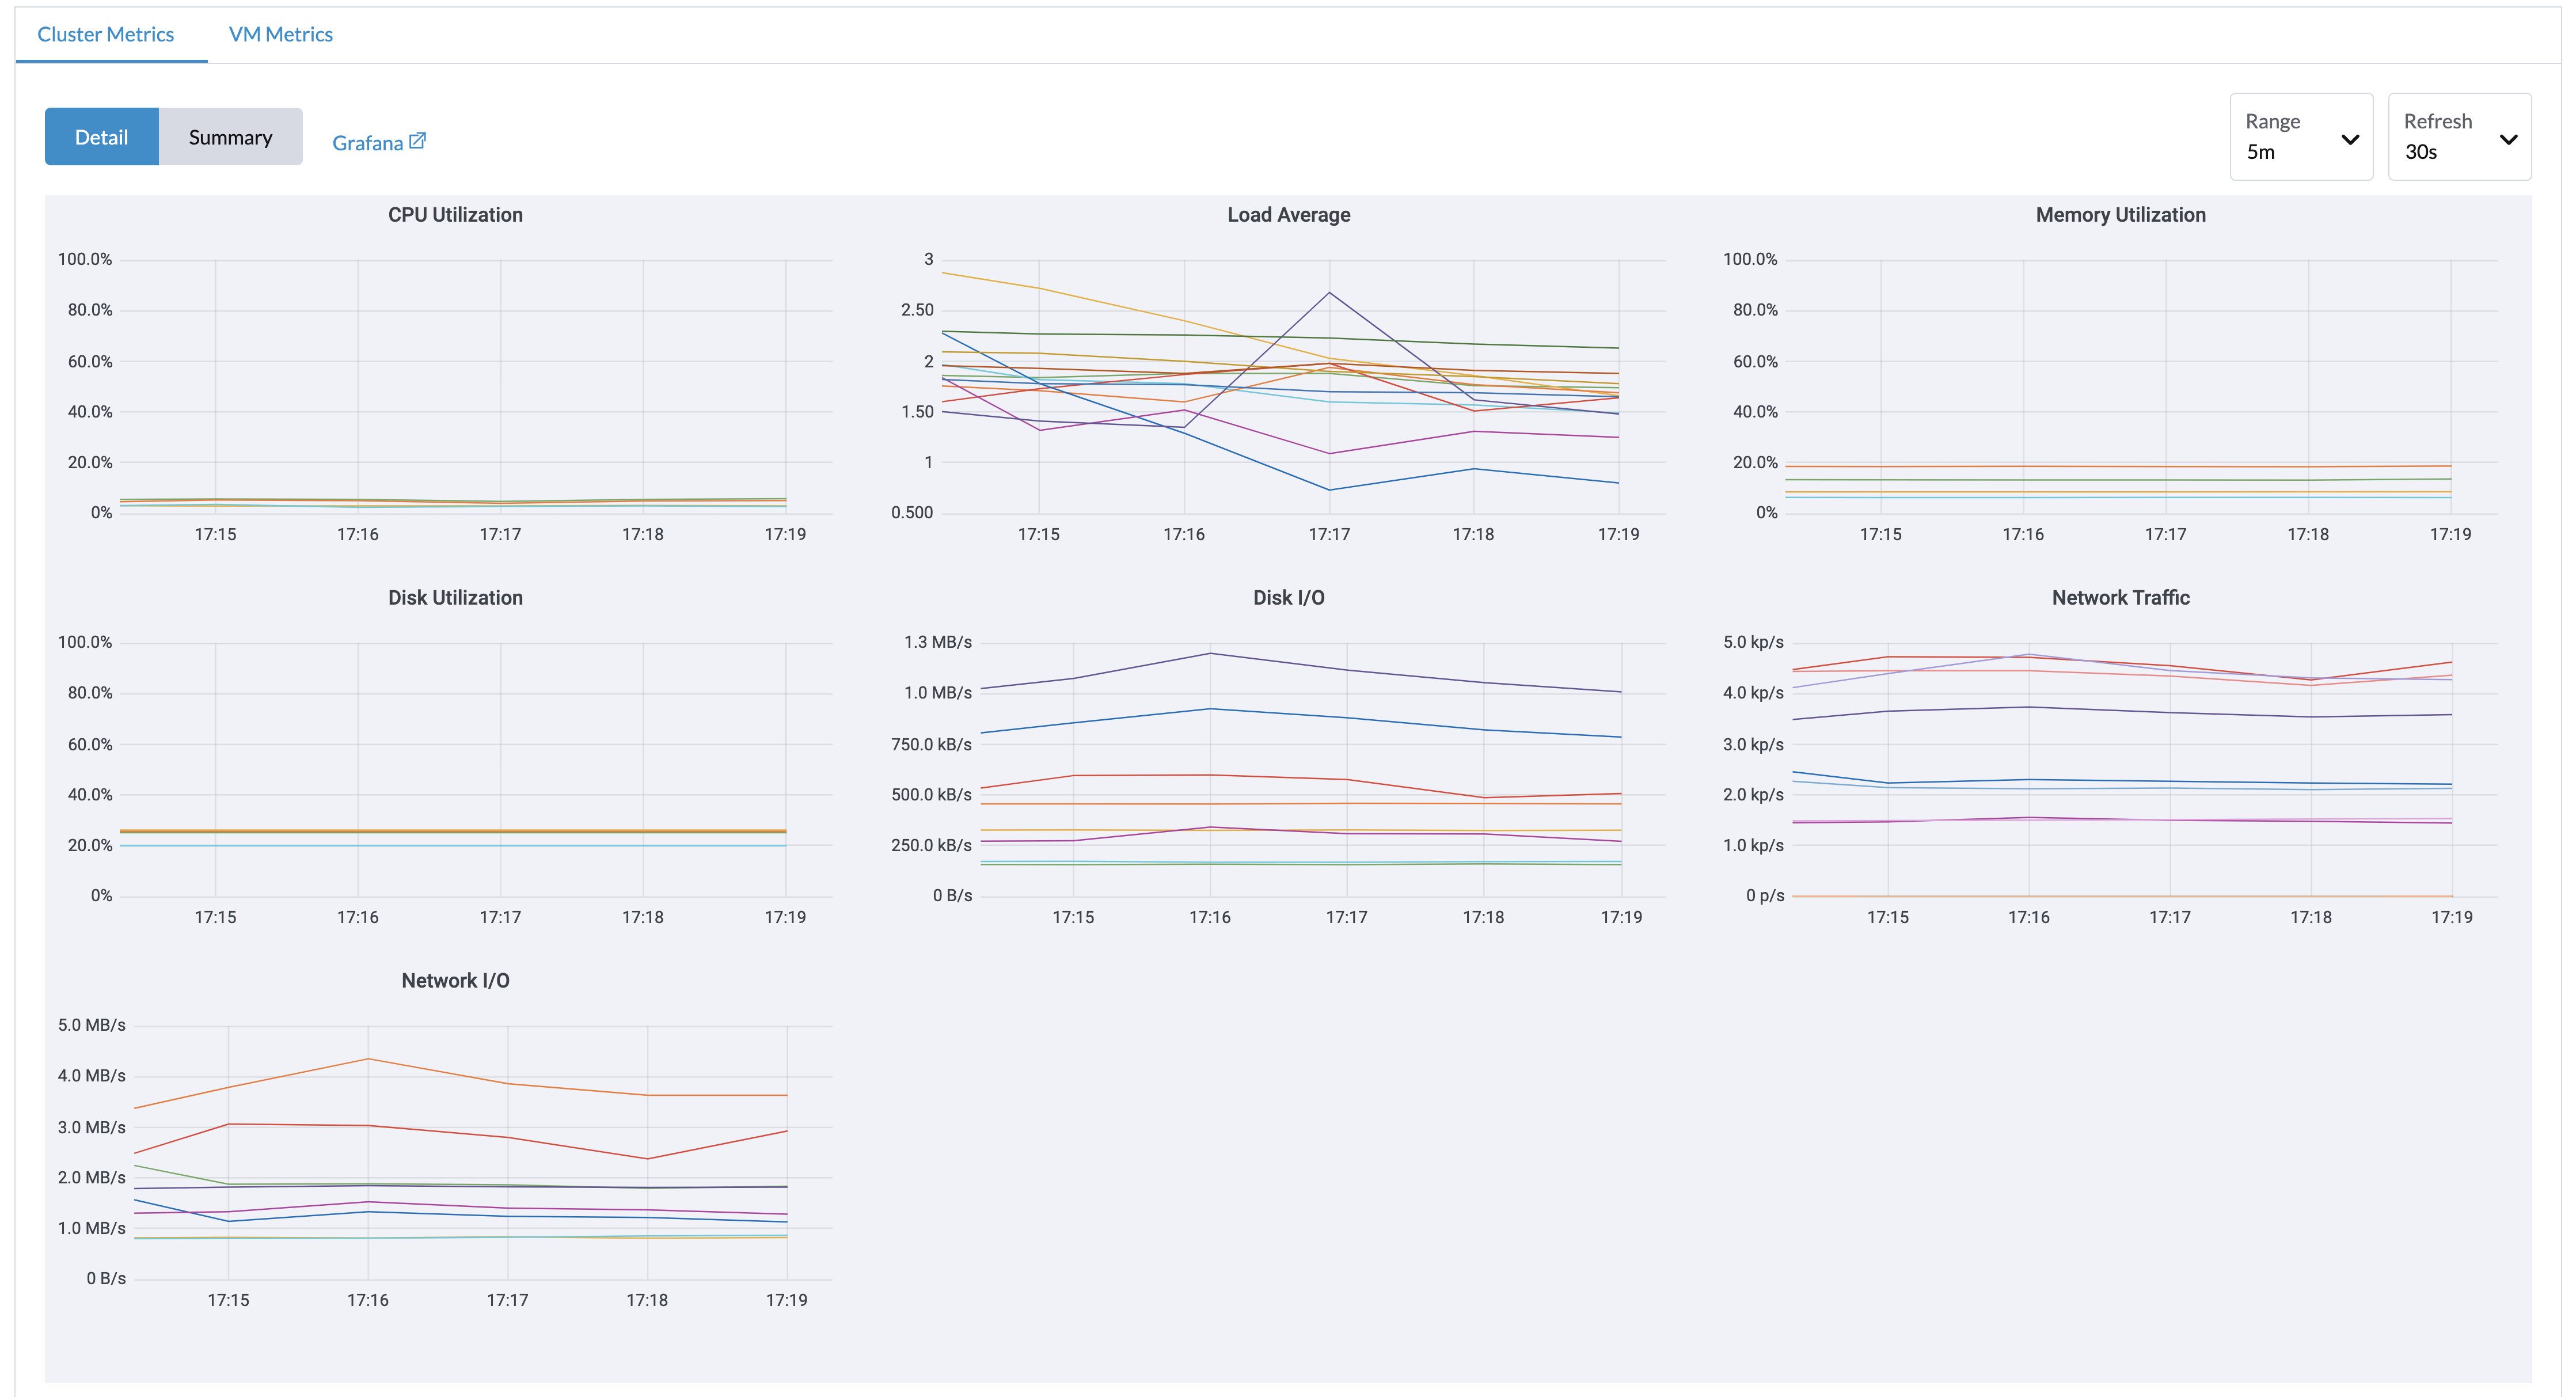
Only admin users are able to view the cluster dashboard metrics.
Additionally, Grafana is provided by rancher-monitoring, so the default admin password is: prom-operator
Reference: values.yaml
VM Detail Metrics
For VMs, you can view VM metrics by clicking on the VM details page > VM Metrics.
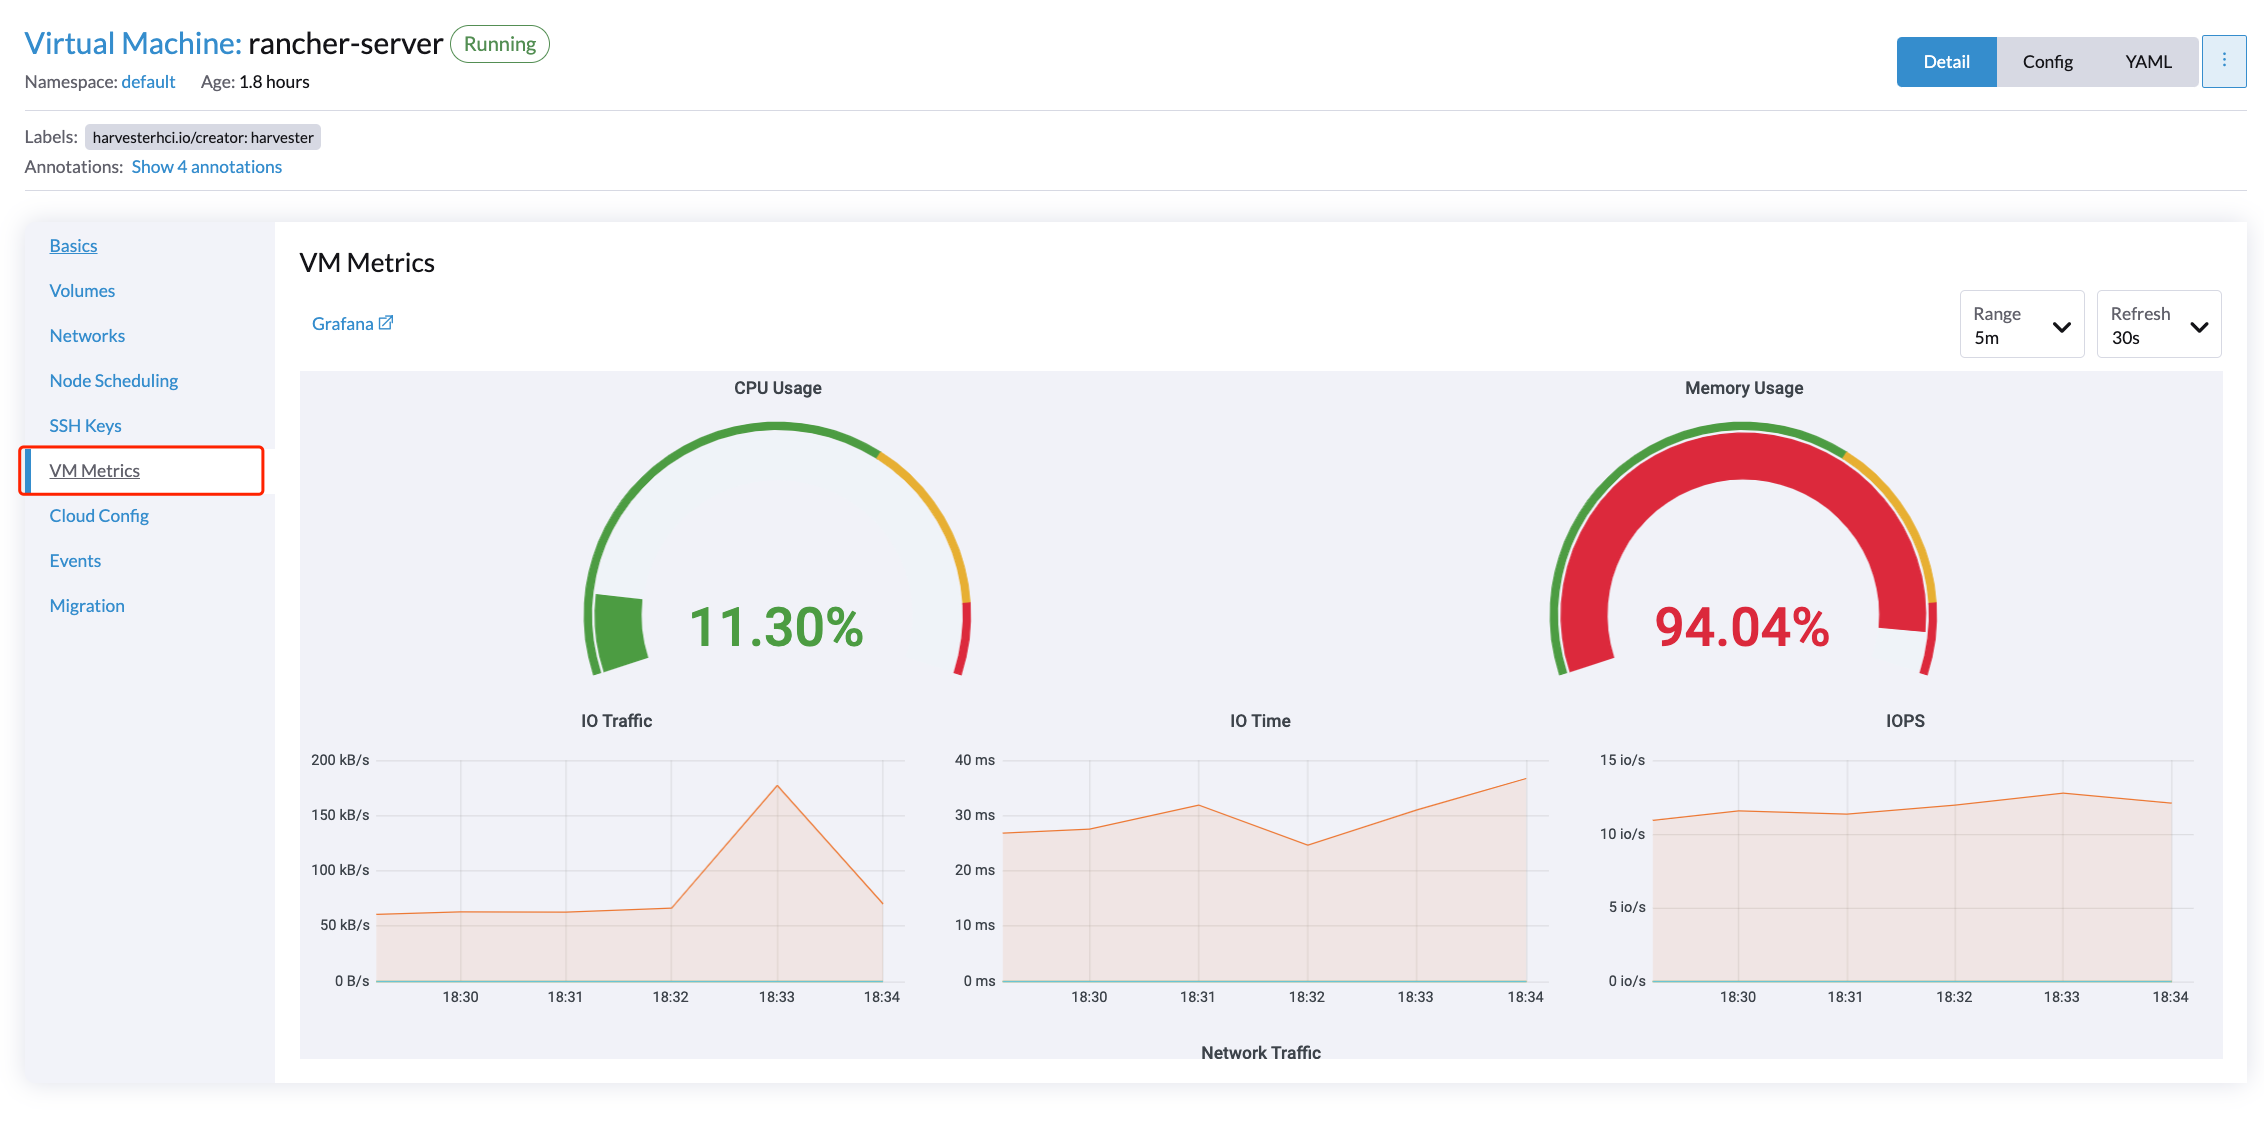
The current Memory Usage is calculated based on (1 - free/total) * 100%, not (used/total) * 100%.
For example, in a Linux OS, the free -h command outputs the current memory statistics as follows
$ free -h
                total        used        free      shared  buff/cache   available
Mem:          7.7Gi       166Mi       4.6Gi       1.0Mi       2.9Gi       7.2Gi
Swap:            0B          0B          0B
The corresponding Memory Usage is (1 - 4.6/7.7) * 100%, roughly 40%.
How to Configure Monitoring Settings
Available as of v1.0.1
Monitoring has several components that help to collect and aggregate metric data from all Nodes/Pods/VMs. The resources required for monitoring depend on your workloads and hardware resources. Harvester sets defaults based on general use cases, and you can change them accordingly.
Currently, Resources Settings can be configured for the following components:
- Prometheus
- Prometheus Node Exporter(UI configurable as of v1.0.2)
From WebUI
On the Monitoring & Logging page, you can view and change the resource settings as follows:
Navigate to the
Monitoring > Configurationpage.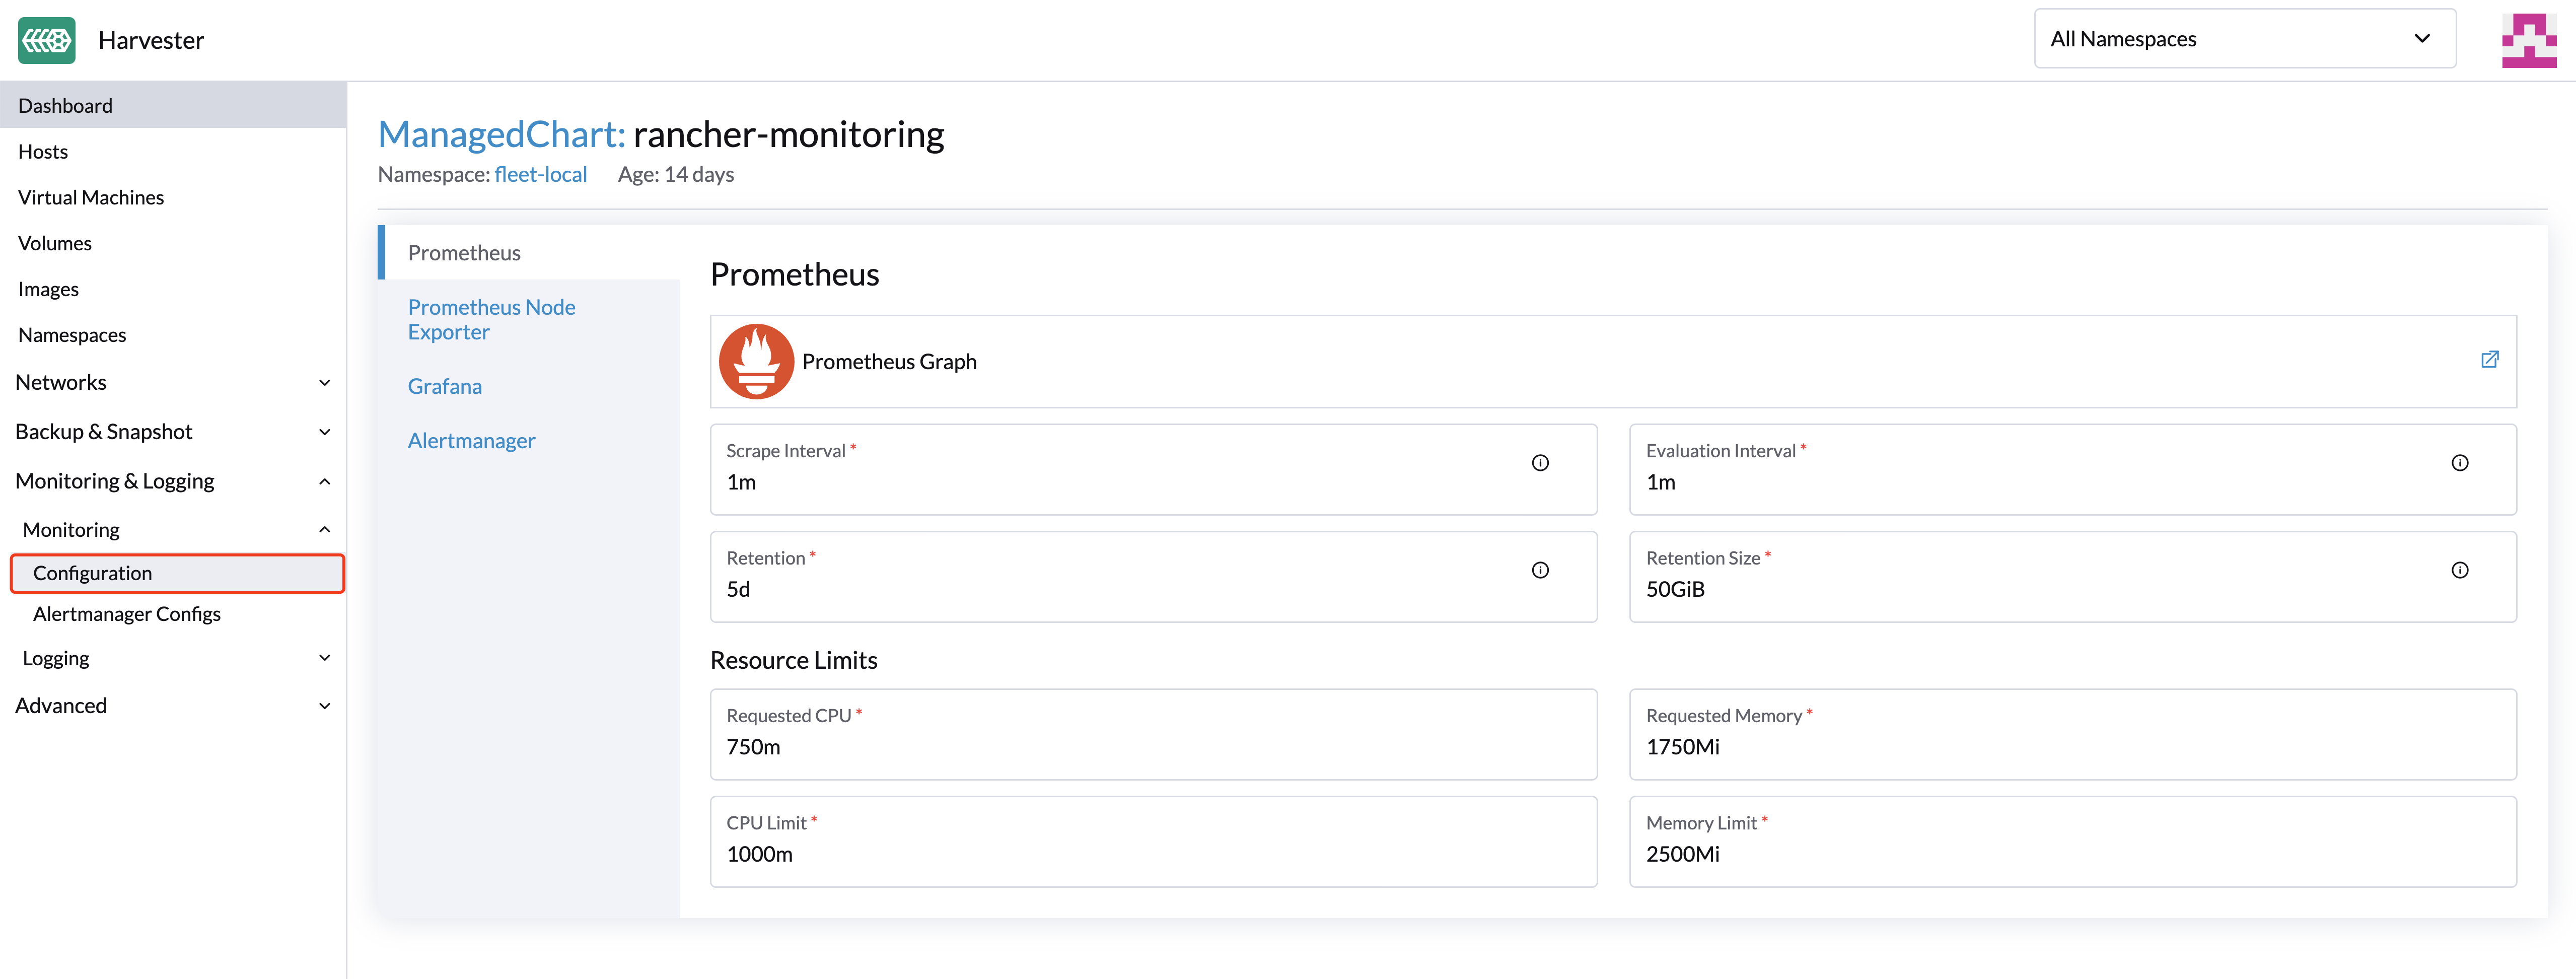
Click
Saveand theMonitoringresource will be restarted within a few seconds. Please be aware that the reboot can take some time to reload previous data.
The most frequently used option is the memory setting:
The
Requested Memoryis the minimum memory required by theMonitoringresource. The recommended value is about 5% to 10% of the system memory of one single management node. A value less than 500Mi will be denied.The
Memory Limitis the maximum memory that can be allocated to aMonitoringresource. The recommended value is about 30% of the system's memory for one single management node. When theMonitoringreaches this threshold, it will automatically restart.
Depending on the available hardware resources and system loads, you may change the above settings accordingly.
If you have multiple management nodes with different hardware resources, please set the value of Prometheus based on the smaller one.
When an increasing number of VMs get deployed on one node, the prometheus-node-exporter pod might get killed due to OOM(out of memory). In that case, you should increase the value of limits.memory.
From CLI
To update those values, you can also use the CLI command with: $kubectl edit managedchart rancher-monitoring -n fleet-local.
For Harvester version >= v1.0.1, the related path and default value are:
# Prometheus configs
spec.values.prometheus.prometheusSpec.resources.limits.cpu: 1000m
spec.values.prometheus.prometheusSpec.resources.limits.memory: 2500Mi
spec.values.prometheus.prometheusSpec.resources.requests.cpu: 750m
spec.values.prometheus.prometheusSpec.resources.requests.memory: 1750Mi
---
# node exporter configs
spec.values.prometheus-node-exporter.resources.limits.cpu: 200m
spec.values.prometheus-node-exporter.resources.limits.memory: 180Mi
spec.values.prometheus-node-exporter.resources.requests.cpu: 100m
spec.values.prometheus-node-exporter.resources.requests.memory: 30Mi
For versions <= v1.0.0, the related path and default value are not specified in the managedchart rancher-monitoring, you need to add them accordingly.
Alertmanager
Available as of v1.1.0
Harvester uses Alertmanager to collect and manage all the alerts that happened/happening in the cluster.
Alertmanager Config
Enable/Disable Alertmanager
Alertmanager is enabled by default. You may disable it from the following config path.
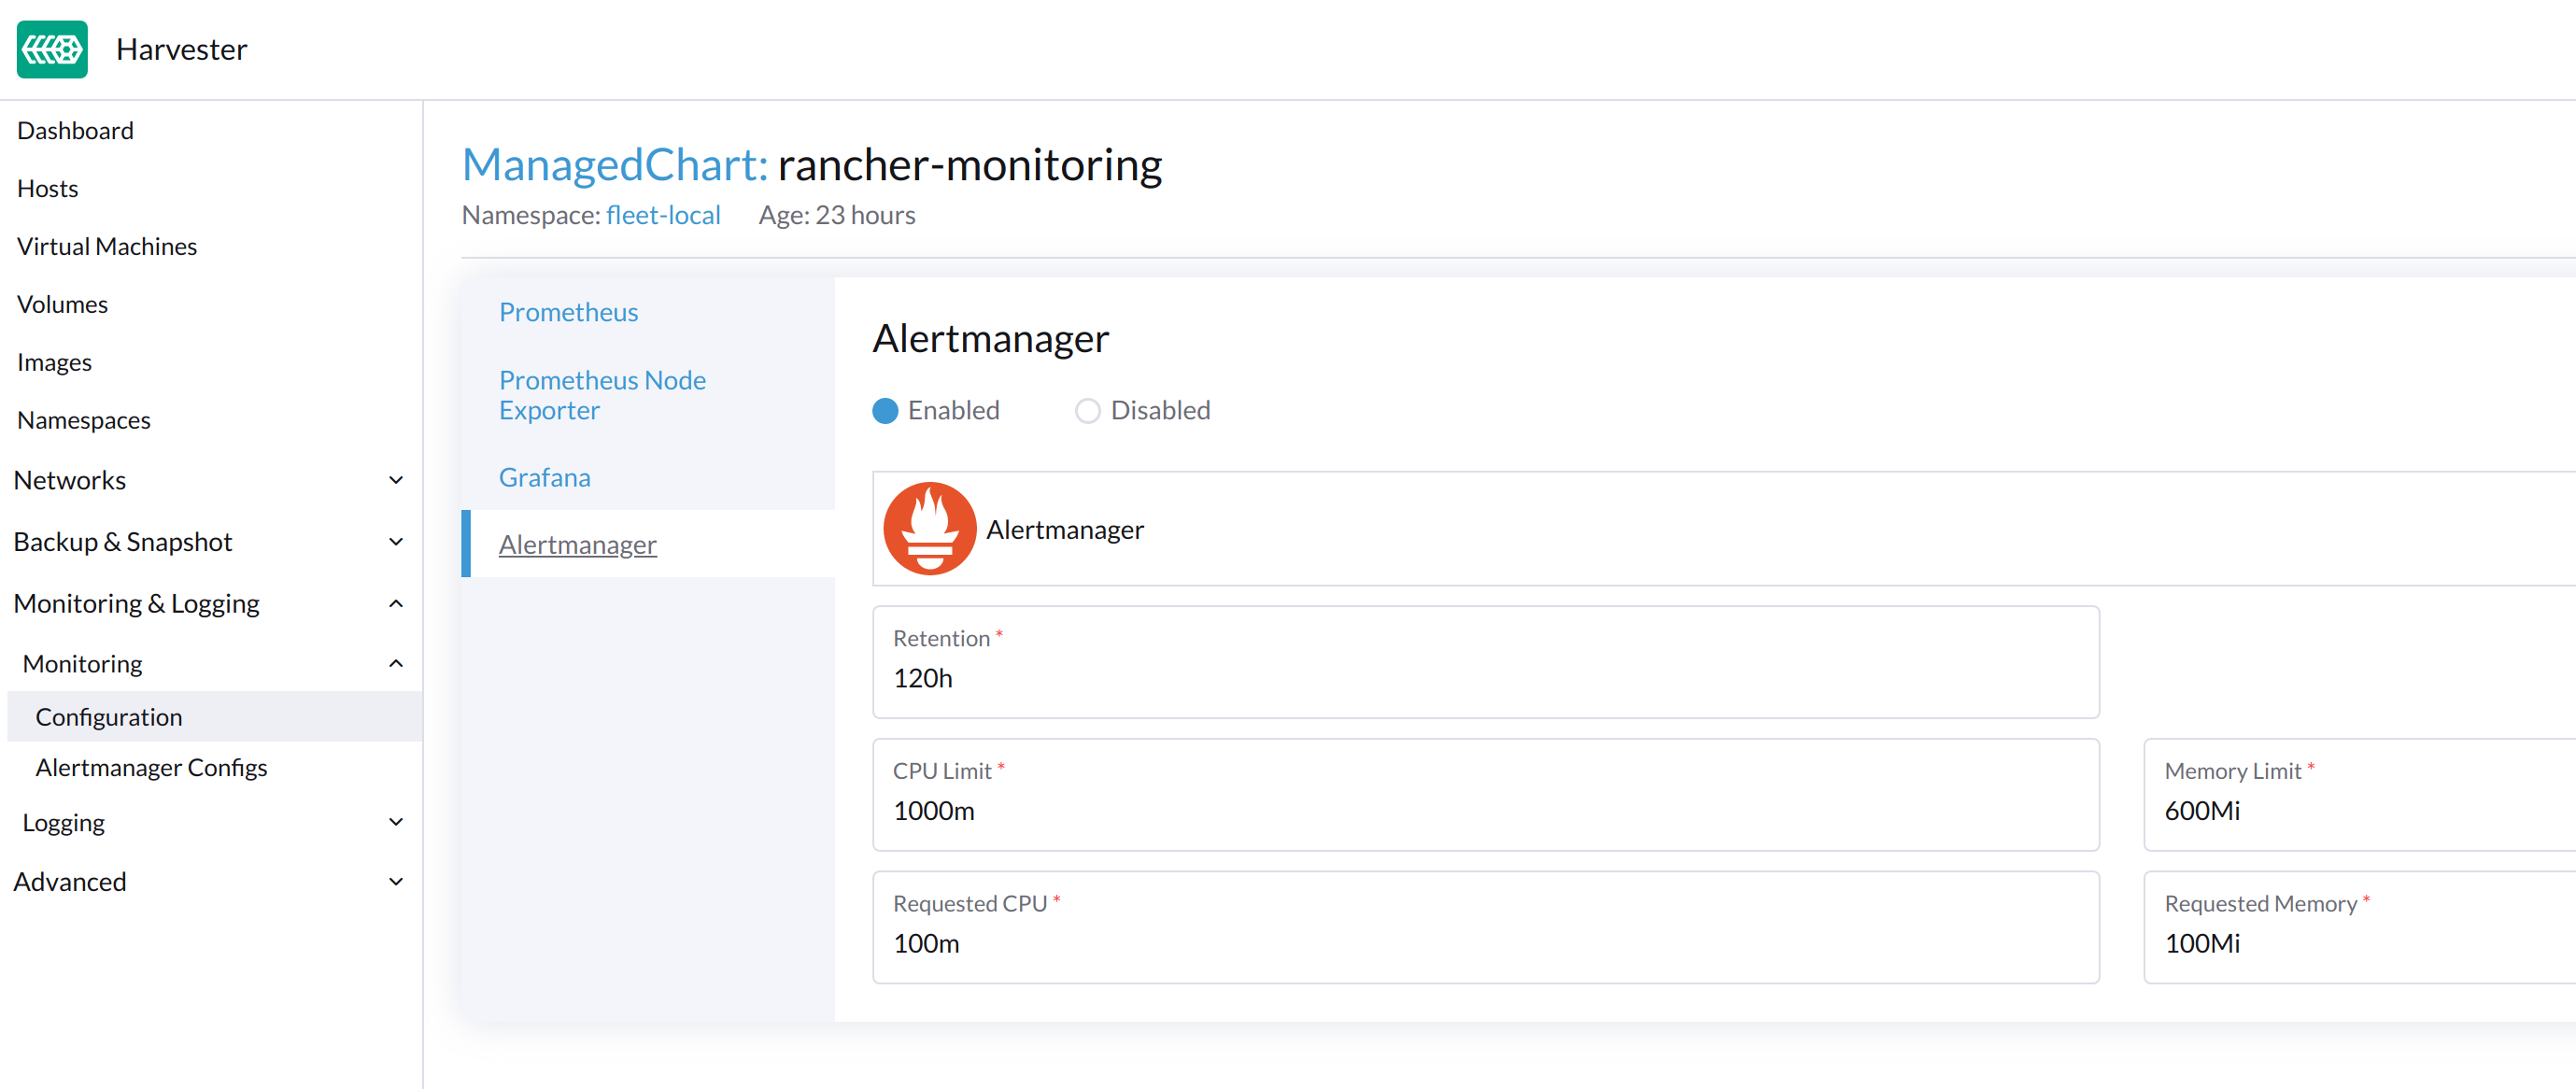
Change Resource Setting
You can also change the resource settings of Alertmanager as shown in the picture above.
Configure AlertmanagerConfig from WebUI
To send the alerts to third-party servers, you need to config AlertmanagerConfig.
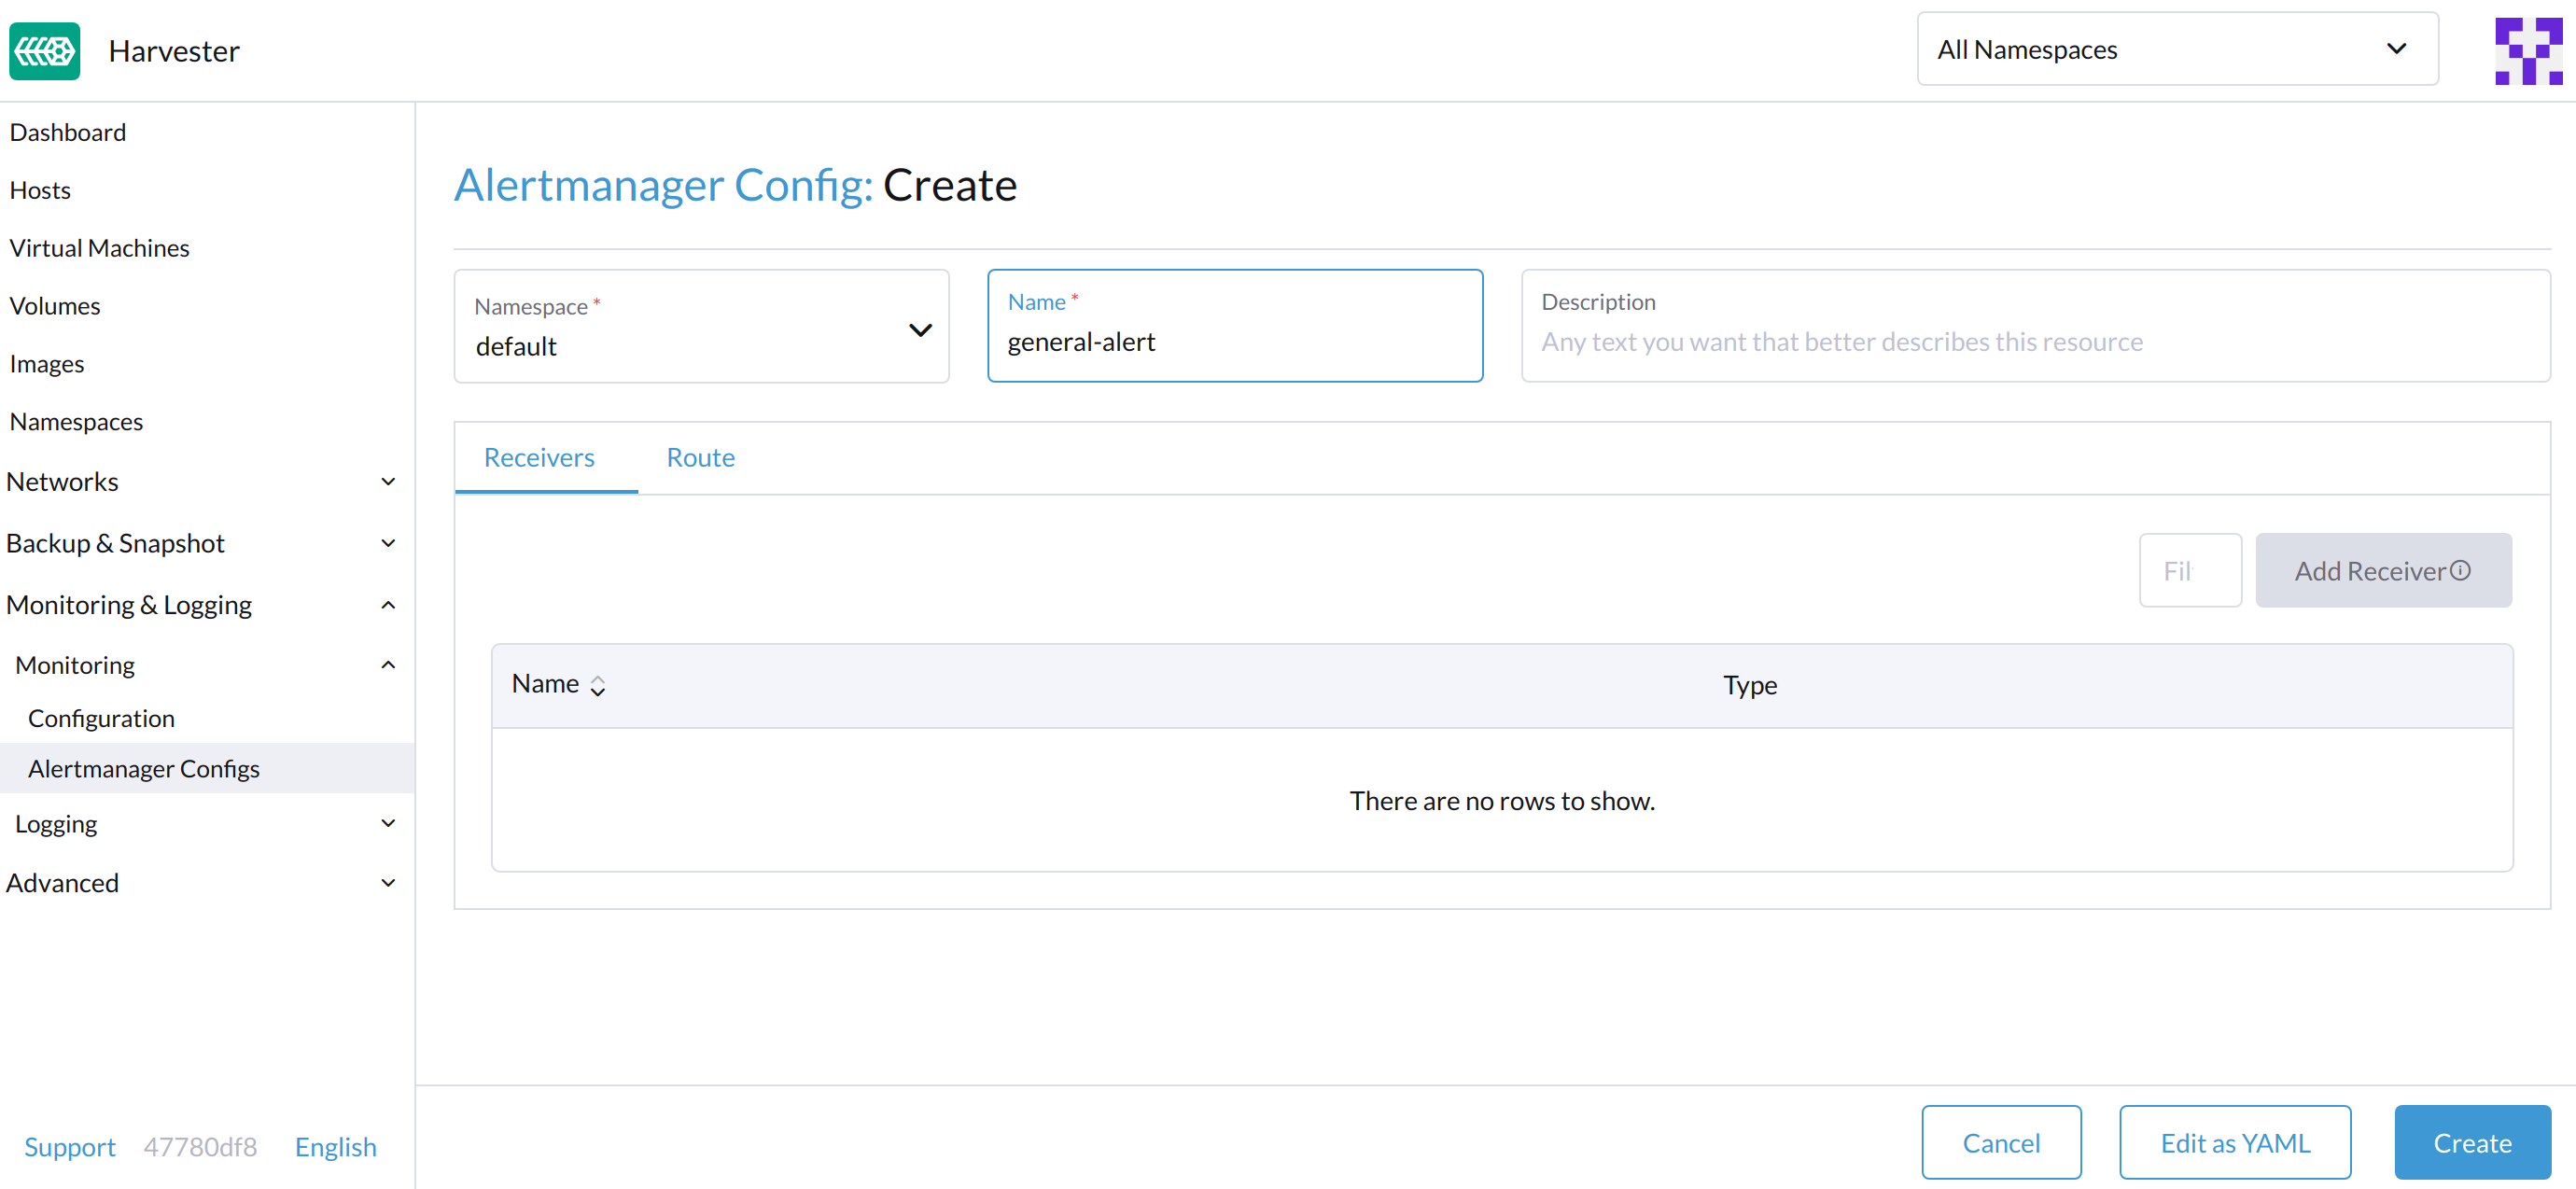
On the WebUI, navigate to Monitoring & Logging -> Monitoring -> Alertmanager Configs.
On the Alertmanager Config: Create page, click Namespace to select the target namespace from the drop-down list and set the Name. After this, click Create in the lower right corner.
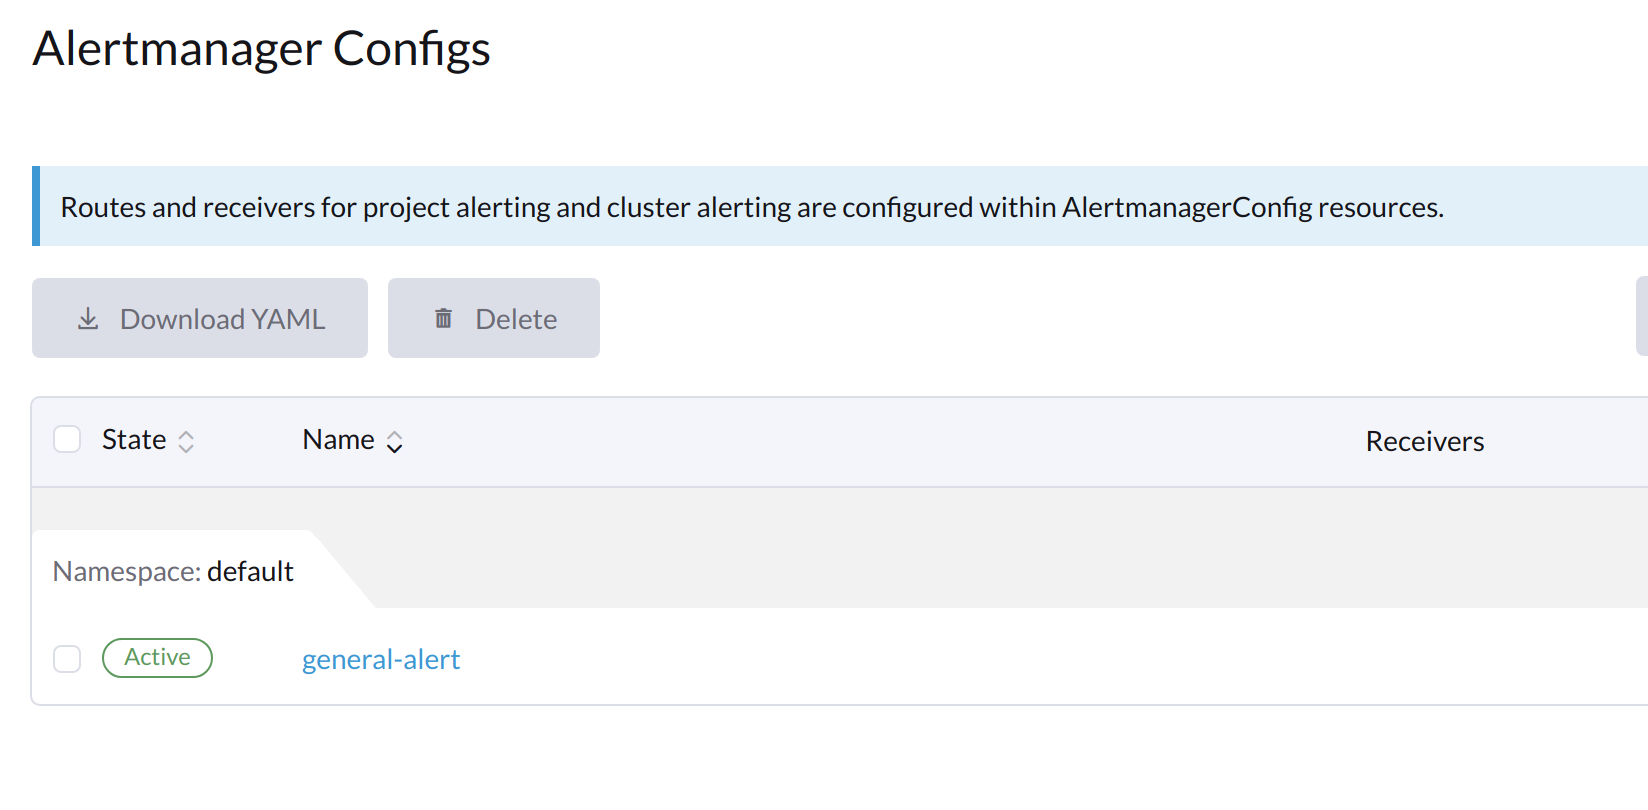
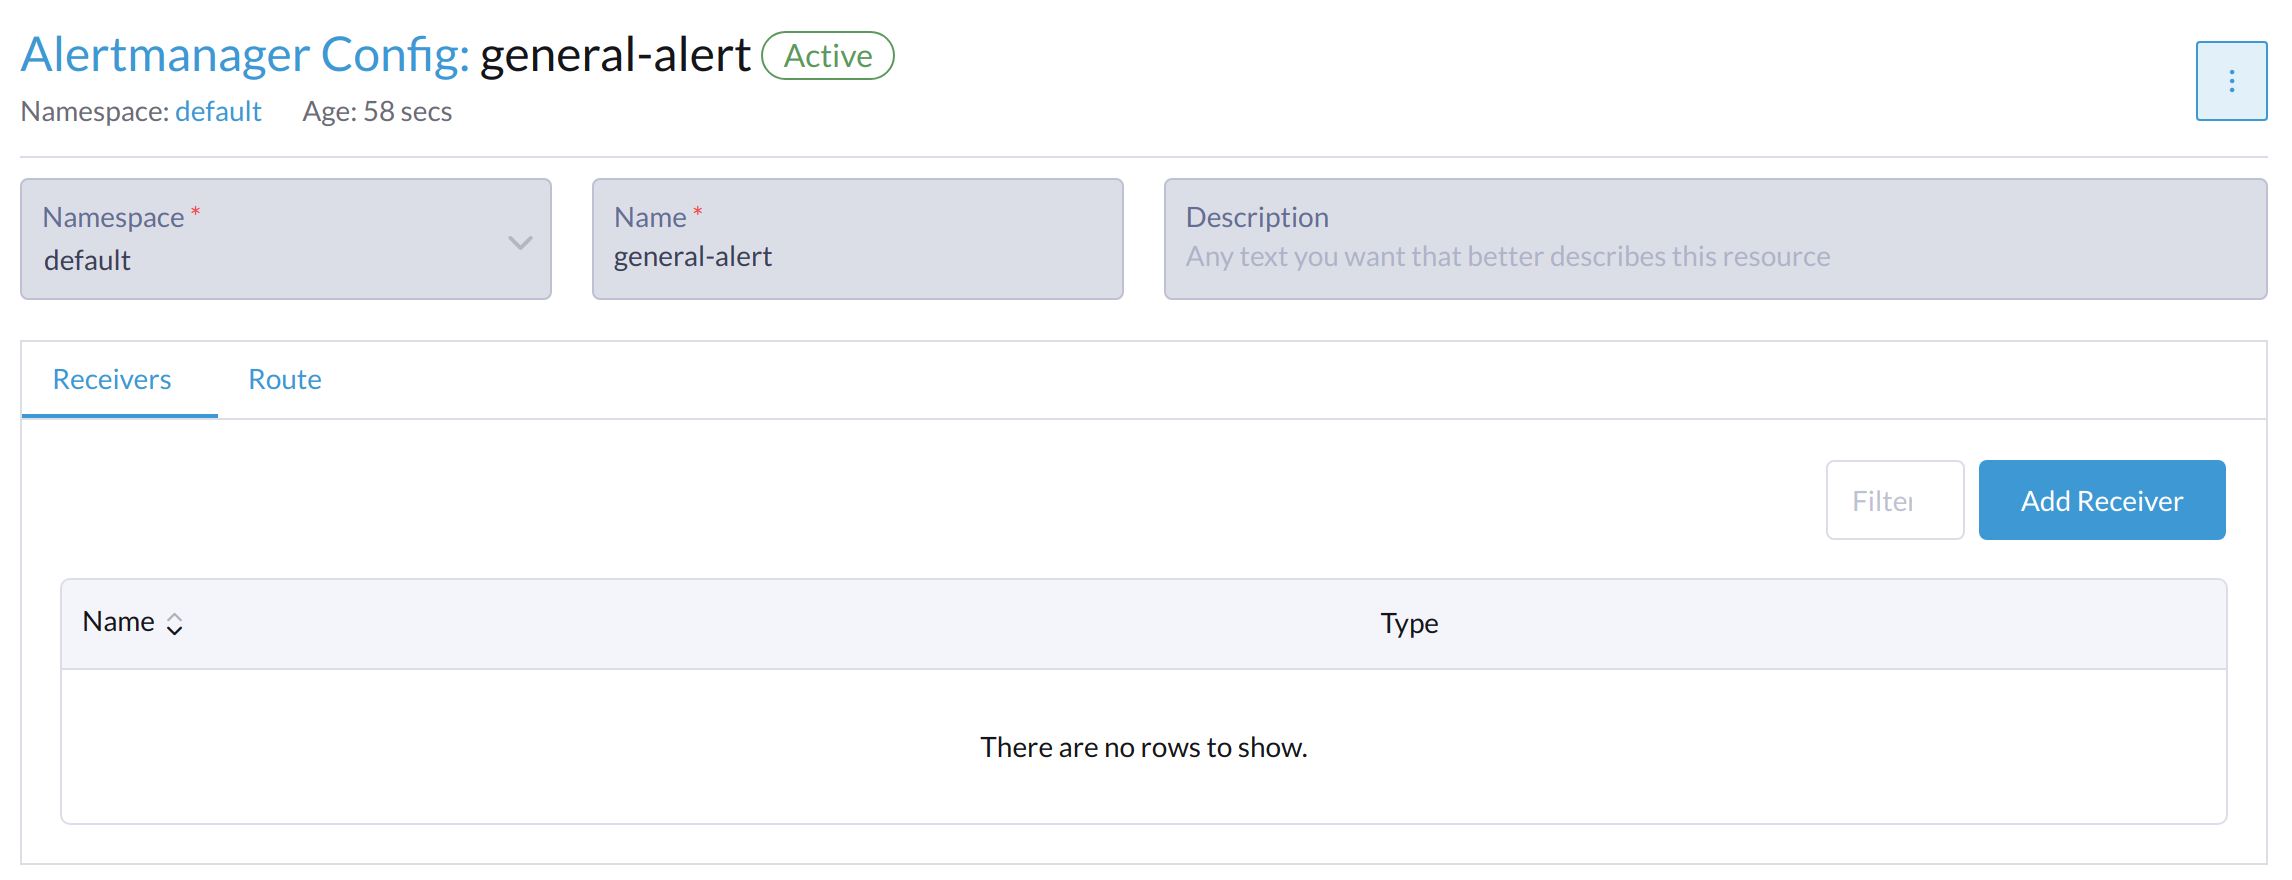
Click the Alertmanager Configs you just created to continue the configuration.
Click Add Receiver.
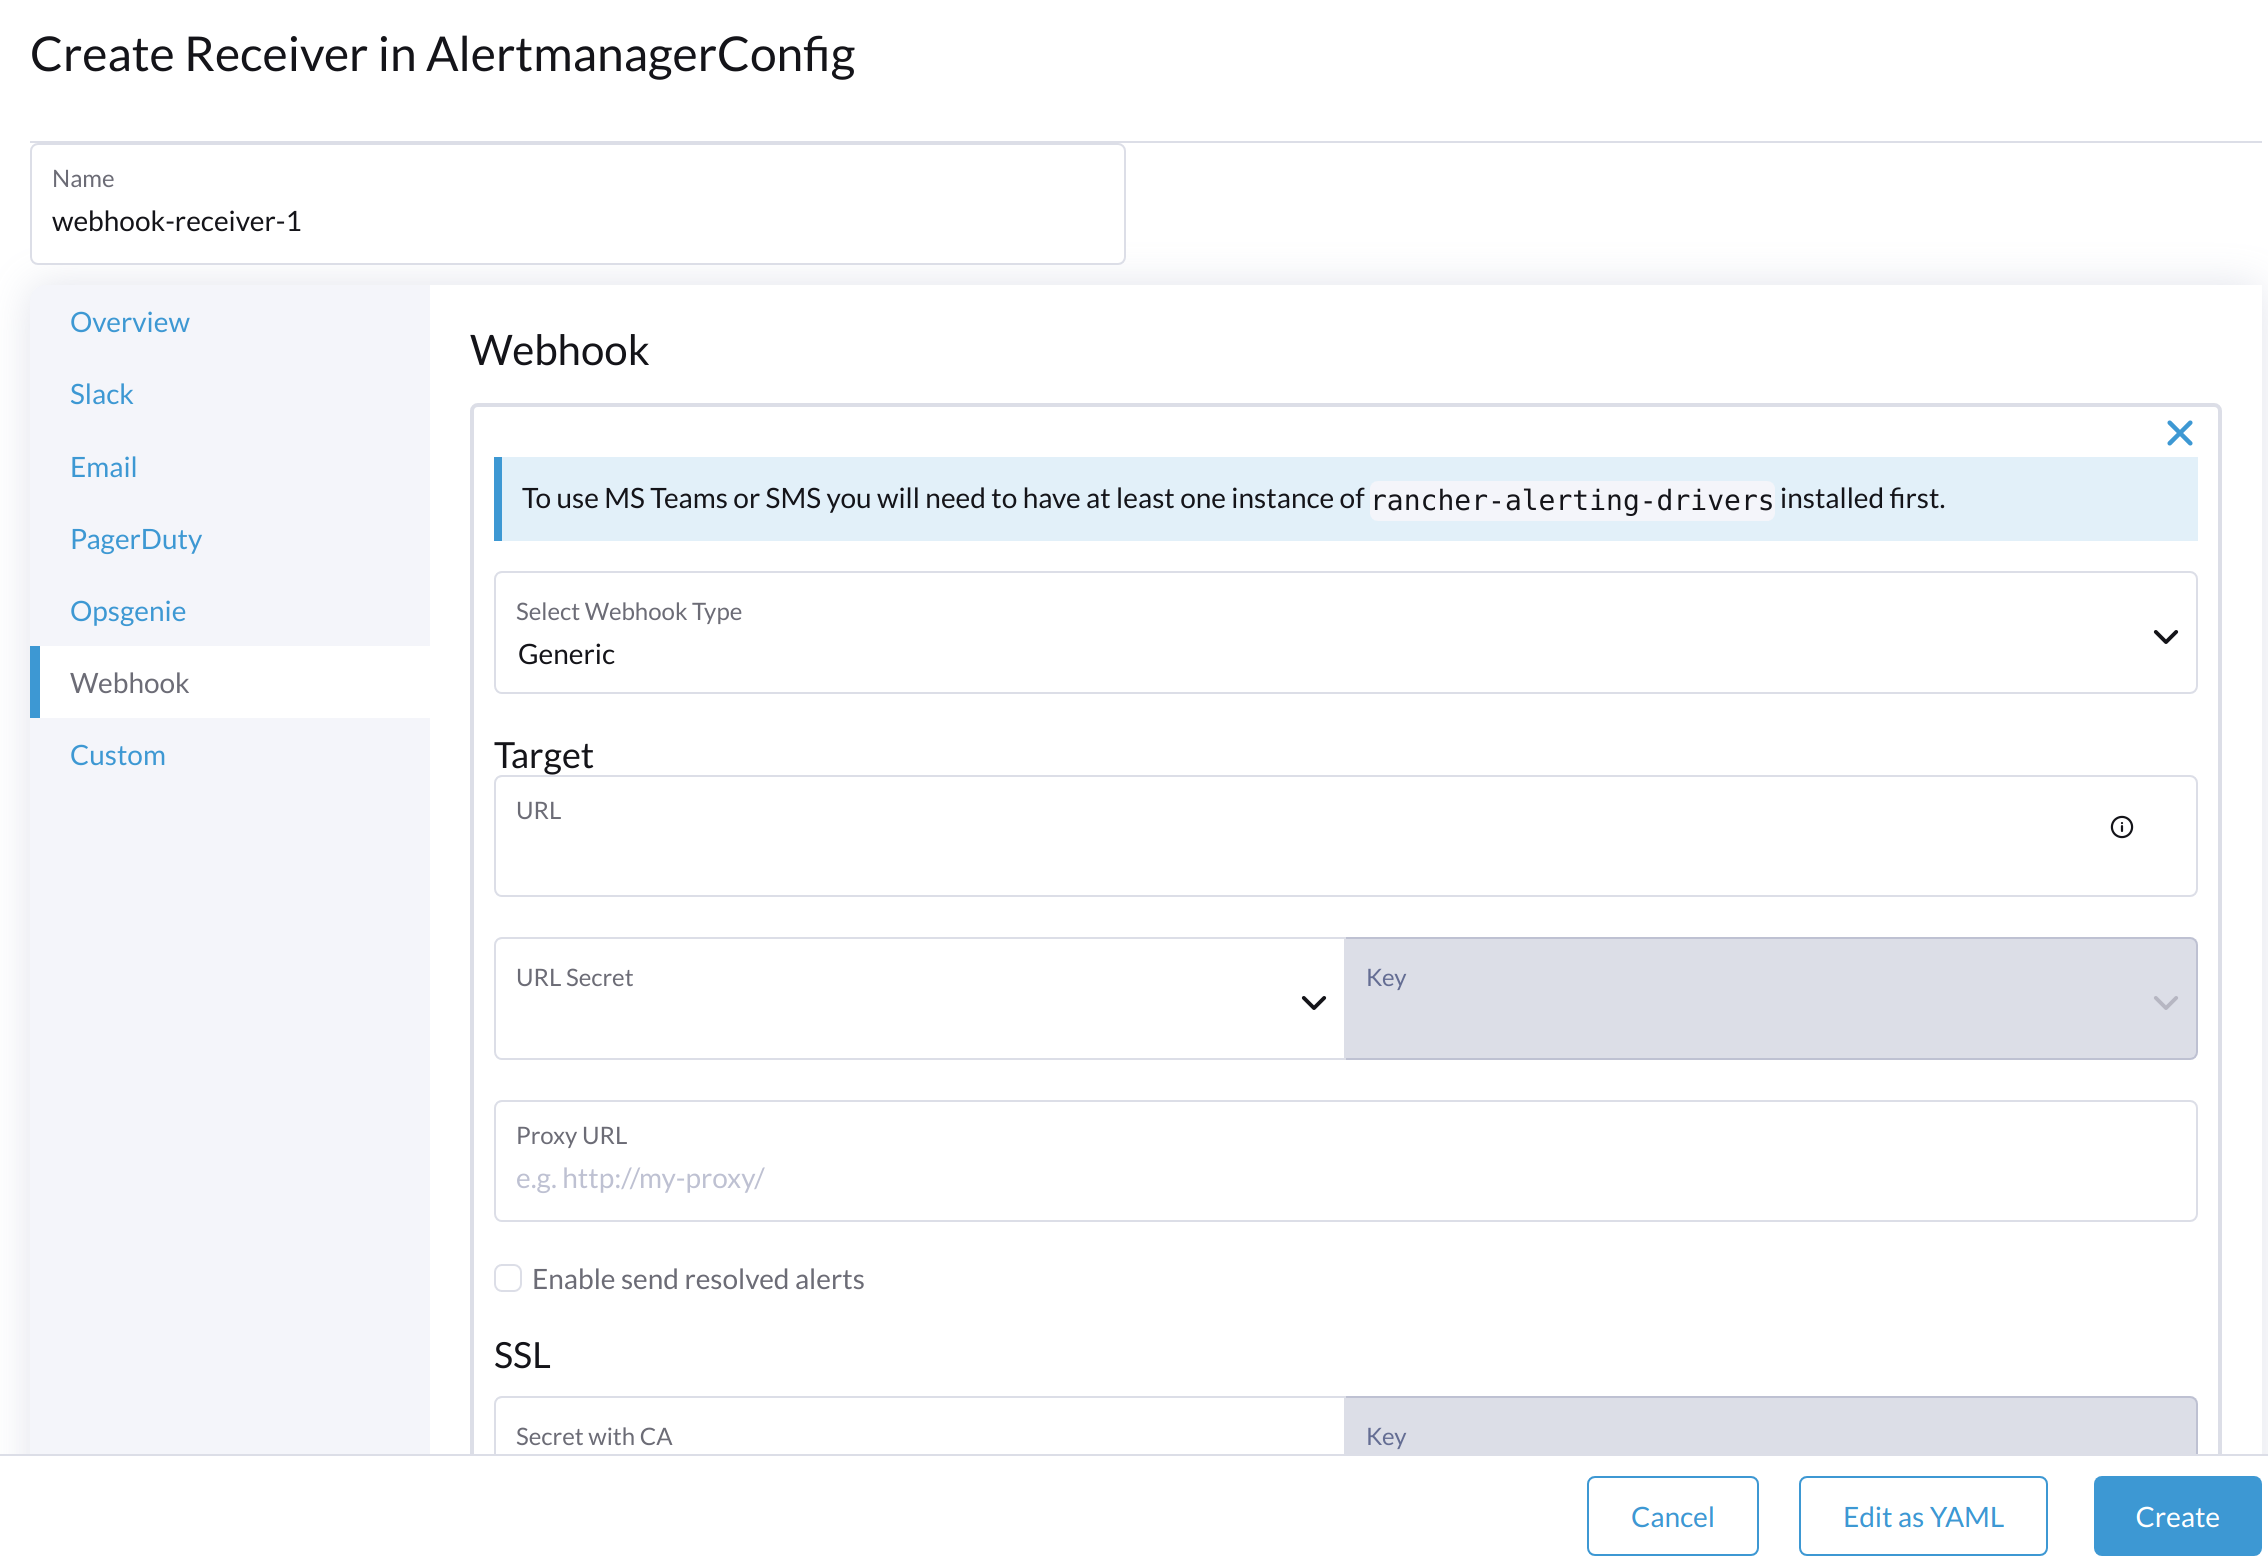
Set the Name for the receiver. After this, select the receiver type, for example, Webhook, and click Add Webhook.
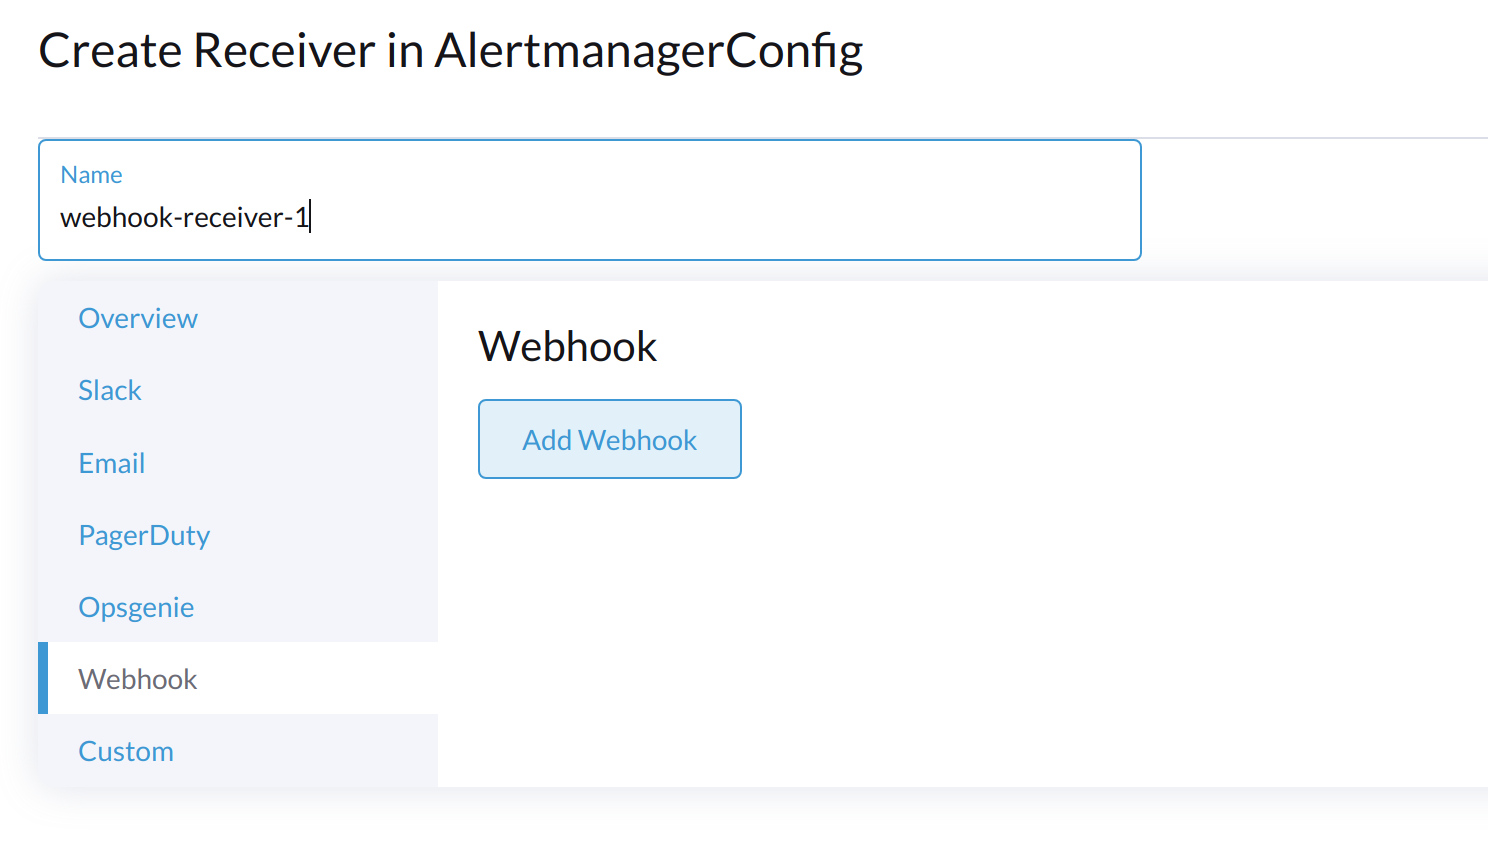
Fill in the required parameters and click Create.
Configure AlertmanagerConfig from CLI
You can also add AlertmanagerConfig from the CLI.
Exampe: a Webhook receiver in the default namespace.
cat << EOF > a-single-receiver.yaml
apiVersion: monitoring.coreos.com/v1alpha1
kind: AlertmanagerConfig
metadata:
  name: amc-example
  # namespace: your value
  labels:
    alertmanagerConfig: example
spec:
  route:
    continue: true
    groupBy:
    - cluster
    - alertname
    receiver: "amc-webhook-receiver"
  receivers:
  - name: "amc-webhook-receiver"
    webhookConfigs:
    - sendResolved: true
      url: "http://192.168.122.159:8090/"
EOF

# kubectl apply -f a-single-receiver.yaml
alertmanagerconfig.monitoring.coreos.com/amc-example created

# kubectl get alertmanagerconfig -A
NAMESPACE   NAME          AGE
default     amc-example   27s
Example of an Alert Received by Webhook
Alerts sent to the webhook server will be in the following format:
{
'receiver': 'longhorn-system-amc-example-amc-webhook-receiver',
'status': 'firing',
'alerts': [],
'groupLabels': {},
'commonLabels': {'alertname': 'LonghornVolumeStatusWarning', 'container': 'longhorn-manager', 'endpoint': 'manager', 'instance': '10.52.0.83:9500', 'issue': 'Longhorn volume is Degraded.',
'job': 'longhorn-backend', 'namespace': 'longhorn-system', 'node': 'harv2', 'pod': 'longhorn-manager-r5bgm', 'prometheus': 'cattle-monitoring-system/rancher-monitoring-prometheus',
'service': 'longhorn-backend', 'severity': 'warning'},
'commonAnnotations': {'description': 'Longhorn volume is Degraded for more than 5 minutes.', 'runbook_url': 'https://longhorn.io/docs/1.3.0/monitoring/metrics/',
'summary': 'Longhorn volume is Degraded'},
'externalURL': 'https://192.168.122.200/api/v1/namespaces/cattle-monitoring-system/services/http:rancher-monitoring-alertmanager:9093/proxy',
'version': '4',
'groupKey': '{}/{namespace="longhorn-system"}:{}',
'truncatedAlerts': 0
}
Different receivers may present the alerts in different formats. For details, please refer to the related documents.
Known Limitation
The AlertmanagerConfig is enforced by the namespace. Gloabl-level AlertmanagerConfig without a namespace is not supported.
We have already created a GithHb issue to track upstream changes. Once the feature is available, Harvester will adopt it.
View and Manage Alerts
From Alertmanager Dashboard
You can visit the original dashboard of Alertmanager from the link below. Note that you need to replace the-cluster-vip with the actual cluster-vip:
https://the-cluster-vip/api/v1/namespaces/cattle-monitoring-system/services/http:rancher-monitoring-alertmanager:9093/proxy/#/alerts
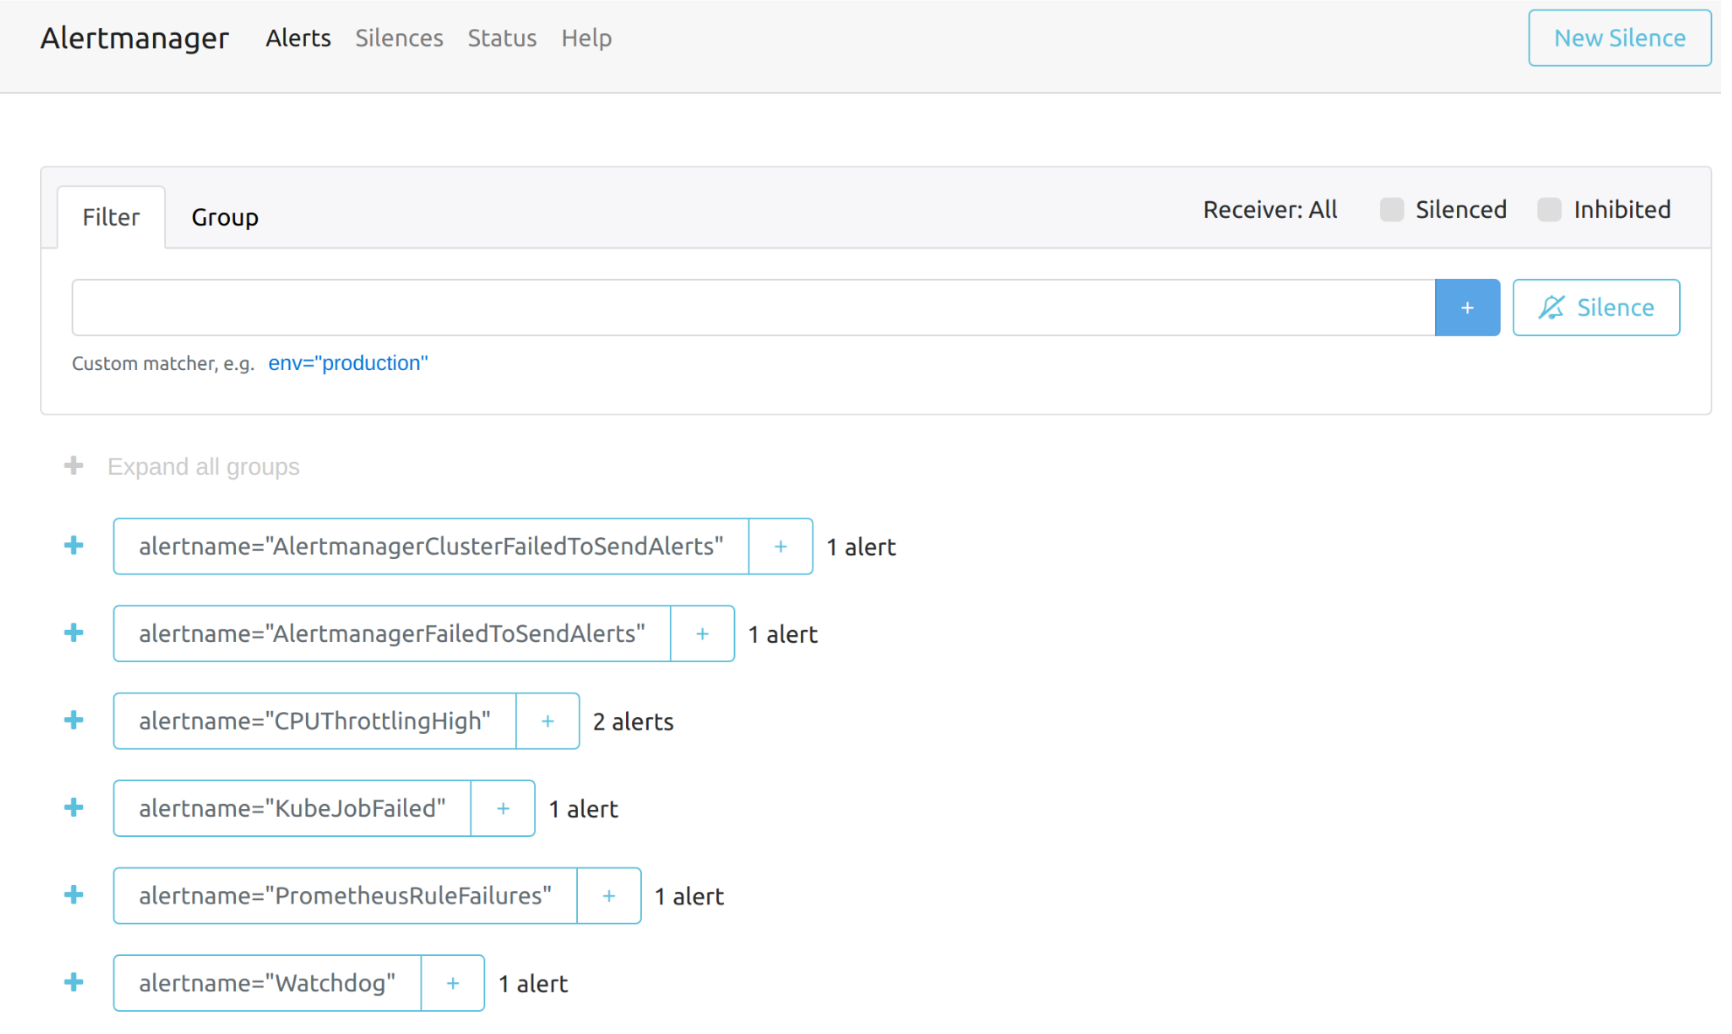
The overall view of the Alertmanager dashboard is as follows.
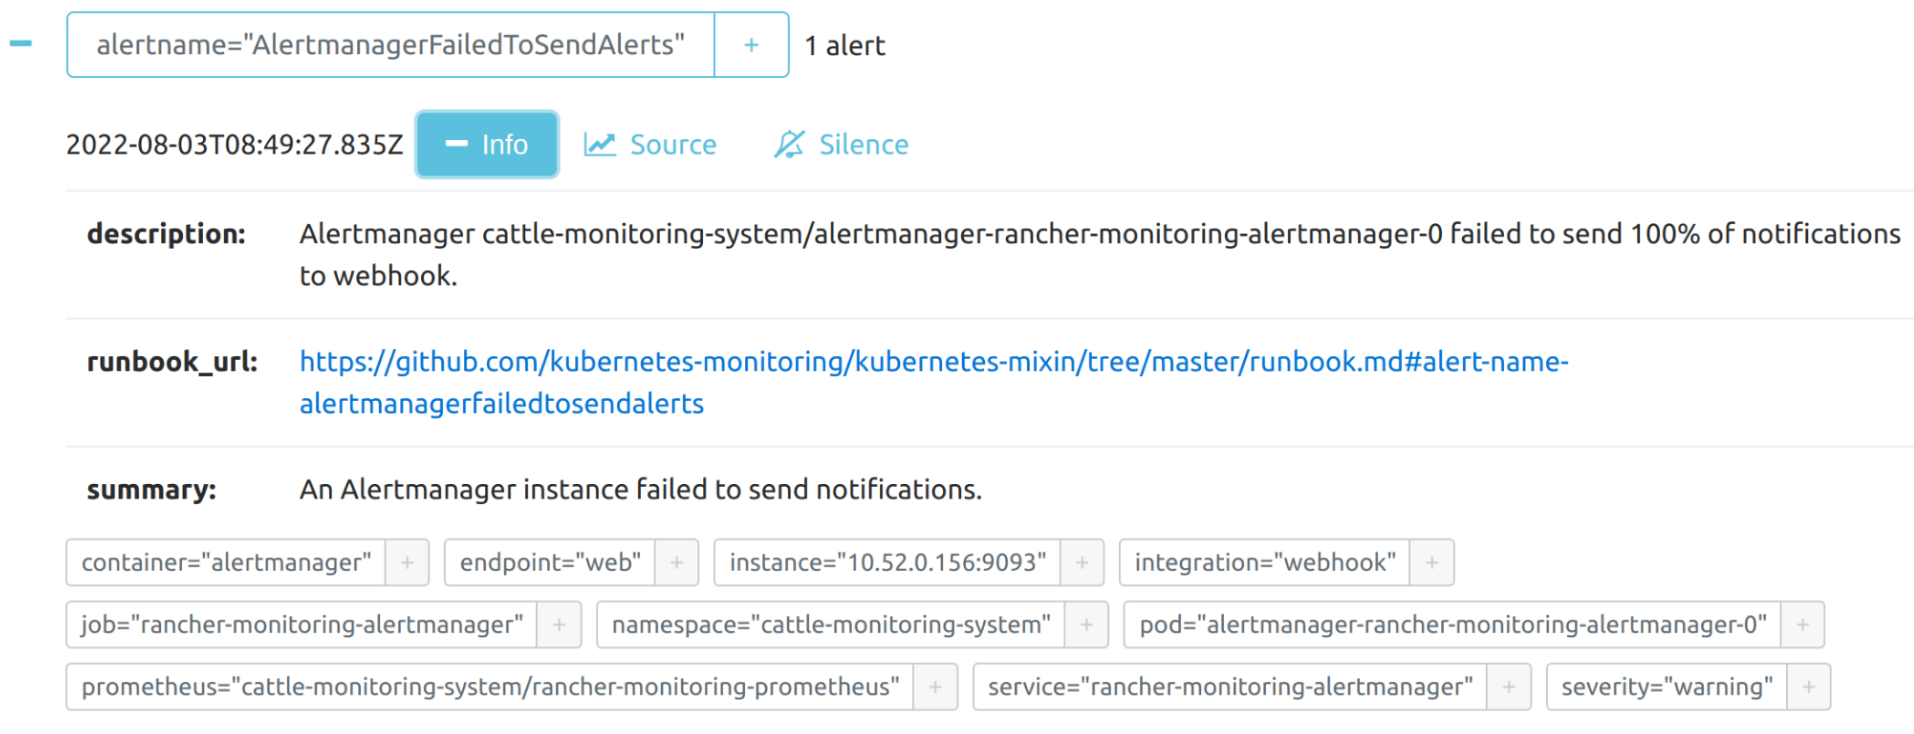
You can view the details of an alert:
From Prometheus Dashboard
You can visit the original dashboard of Prometheus from the link below. Note that you need to replace the-cluster-vip with the actual cluster-vip:
https://the-cluster-vip/api/v1/namespaces/cattle-monitoring-system/services/http:rancher-monitoring-prometheus:9090/proxy/
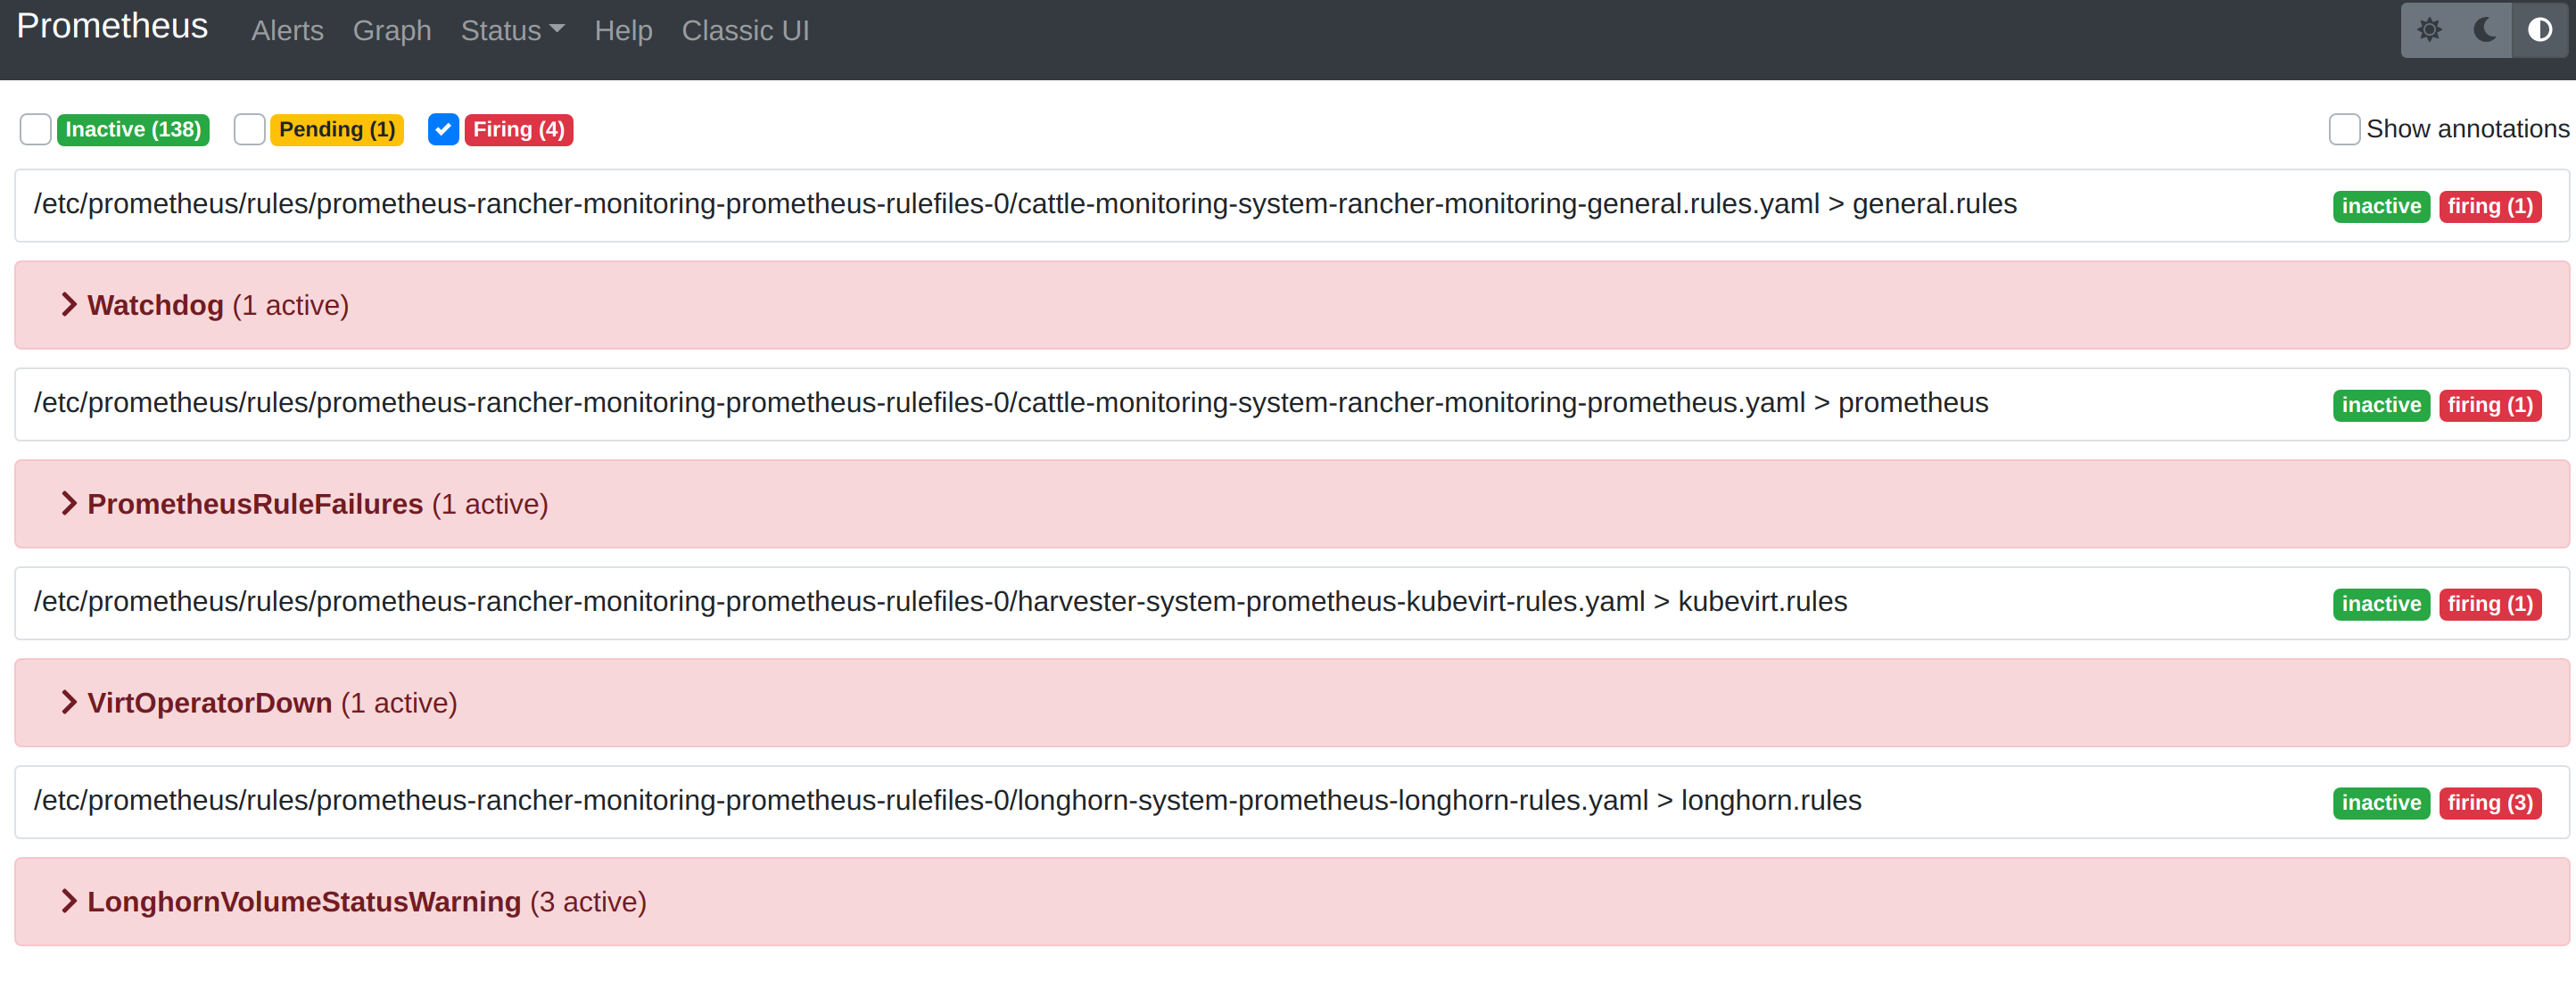
The Alerts menu in the top navigation bar shows all defined rules in Prometheus. You can use the filters Inactive, Pending, and Firing to quickly find the information that you need.
Troubleshooting
For Monitoring support and troubleshooting, please refer to the troubleshooting page .