Monitoring
The following sections contain tips to troubleshoot Harvester Monitoring.
Monitoring is unusable
When the Harvester Dashboard is not showing any monitoring metrics, it can be caused by the following reasons.
Monitoring is unusable due to Pod being stuck in Terminating status
Harvester Monitoring pods are deployed randomly on the cluster Nodes. When the Node hosting the pods accidentally goes down, the related pods may become stuck in the Terminating status rendering the Monitoring unusable from the WebUI.
$ kubectl get pods -n cattle-monitoring-system

NAMESPACE                   NAME                                                     READY   STATUS        RESTARTS   AGE
cattle-monitoring-system    prometheus-rancher-monitoring-prometheus-0               3/3     Terminating   0          3d23h
cattle-monitoring-system    rancher-monitoring-admission-create-fwjn9                0/1     Terminating   0          137m
cattle-monitoring-system    rancher-monitoring-crd-create-9wtzf                      0/1     Terminating   0          137m
cattle-monitoring-system    rancher-monitoring-grafana-d9c56d79b-ph4nz               3/3     Terminating   0          3d23h
cattle-monitoring-system    rancher-monitoring-grafana-d9c56d79b-t24sz               0/3     Init:0/2      0          132m

cattle-monitoring-system    rancher-monitoring-kube-state-metrics-5bc8bb48bd-nbd92   1/1     Running       4          4d1h
...
Monitoring can be recovered using CLI commands to force delete the related pods. The cluster will redeploy new pods to replace them.
# Delete each none-running Pod in namespace cattle-monitoring-system.

$ kubectl delete pod --force -n cattle-monitoring-system prometheus-rancher-monitoring-prometheus-0

 pod "prometheus-rancher-monitoring-prometheus-0" force deleted


$ kubectl delete pod --force -n cattle-monitoring-system rancher-monitoring-admission-create-fwjn9

$ kubectl delete pod --force -n cattle-monitoring-system rancher-monitoring-crd-create-9wtzf

$ kubectl delete pod --force -n cattle-monitoring-system rancher-monitoring-grafana-d9c56d79b-ph4nz

$ kubectl delete pod --force -n cattle-monitoring-system rancher-monitoring-grafana-d9c56d79b-t24sz
Wait for a few minutes so that the new pods are created and readied for the Monitoring dashboard to be usable again.
$ kubectl get pods -n cattle-monitoring-system

NAME                                                     READY   STATUS     RESTARTS   AGE
prometheus-rancher-monitoring-prometheus-0               0/3     Init:0/1   0          98s
rancher-monitoring-grafana-d9c56d79b-cp86w               0/3     Init:0/2   0          27s
...

$ kubectl get pods -n cattle-monitoring-system

NAME                                                     READY   STATUS    RESTARTS   AGE
prometheus-rancher-monitoring-prometheus-0               3/3     Running   0          7m57s
rancher-monitoring-grafana-d9c56d79b-cp86w               3/3     Running   0          6m46s
...
Expand PV/Volume Size
Harvester integrates Longhorn as the default storage provider.
Harvester Monitoring uses Persistent Volume (PV) to store running data. When a cluster has been running for a certain time, the Persistent Volume may need to expand its size.
Based on the Longhorn Volume expansion guide, Harvester illustrates how to expand the volume size.
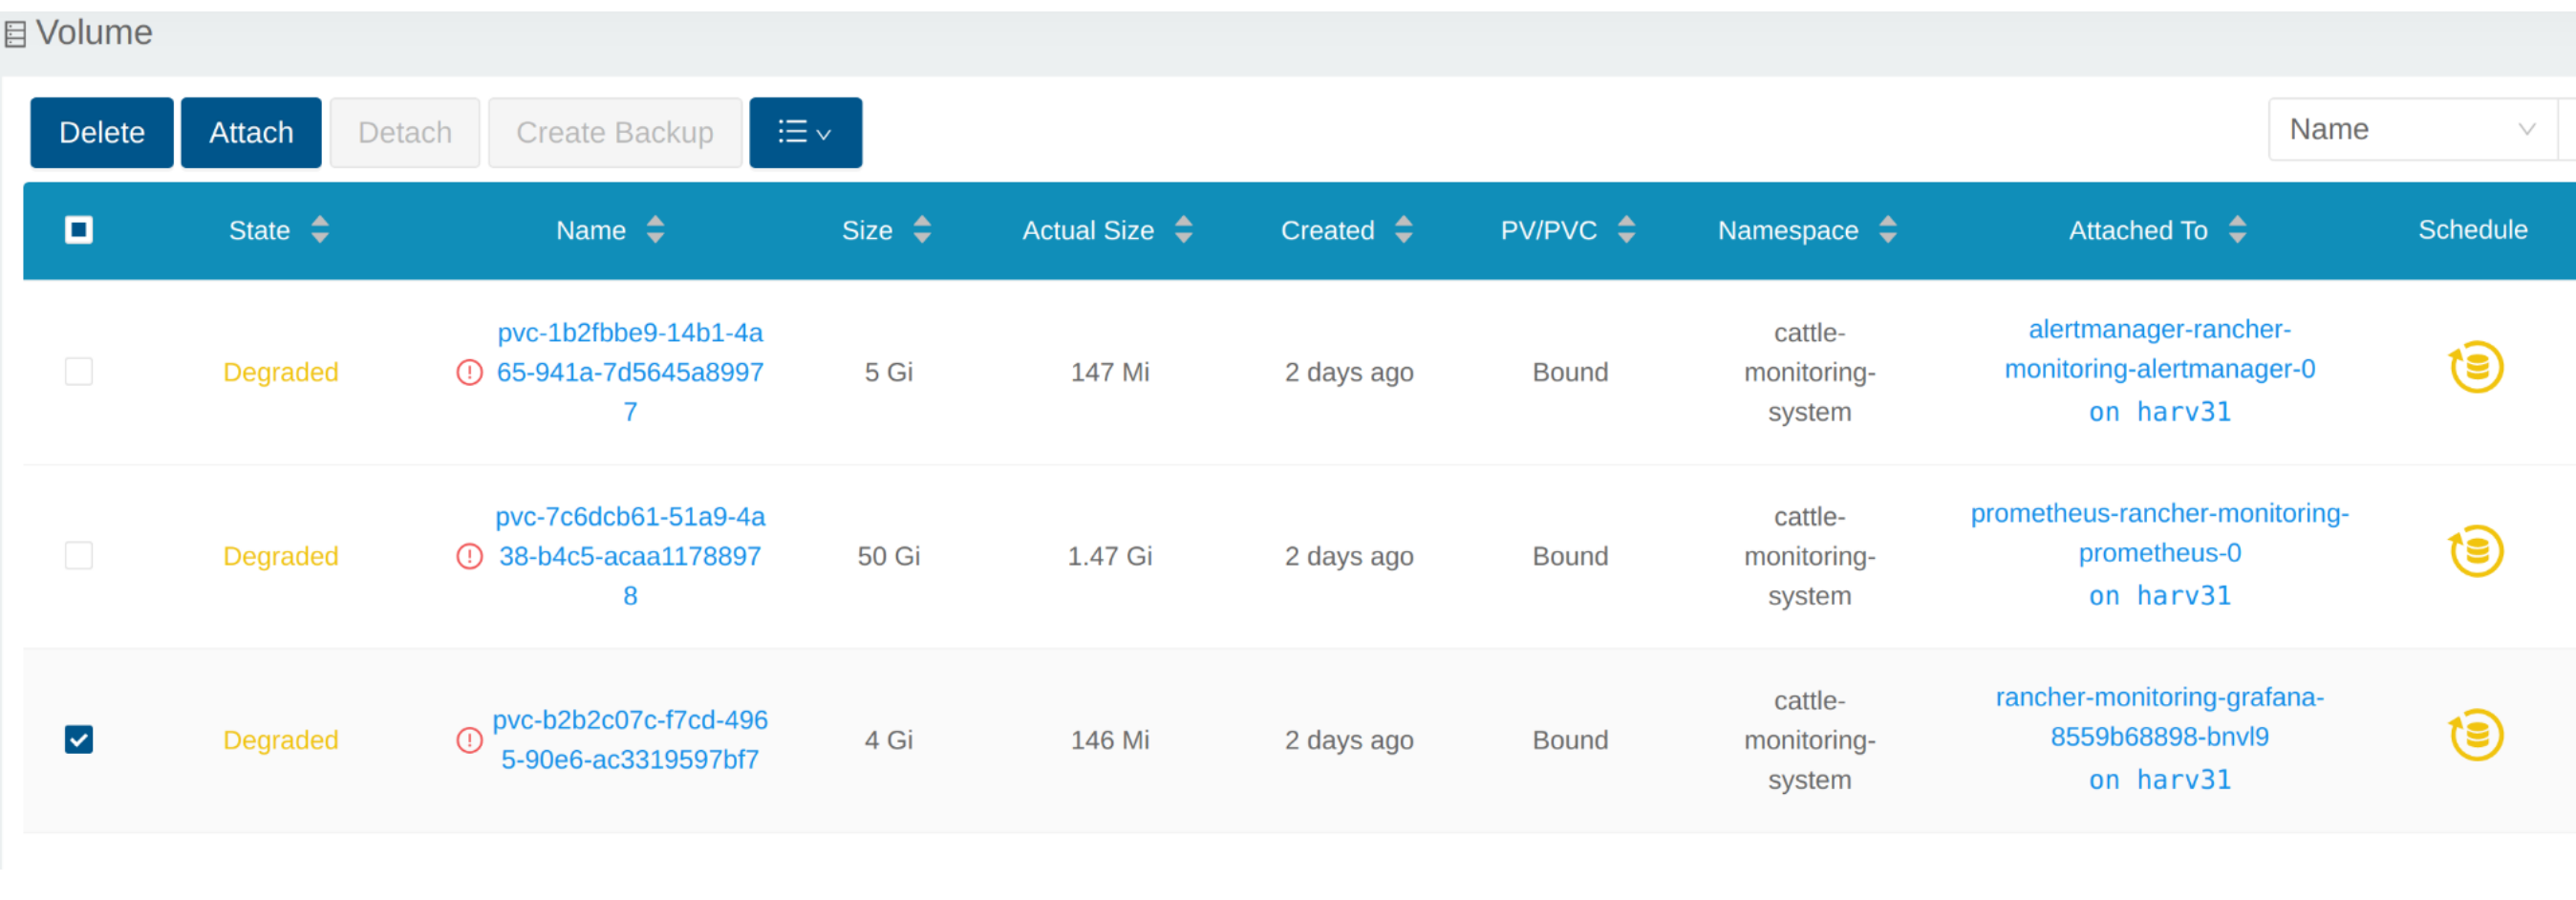
View Volume
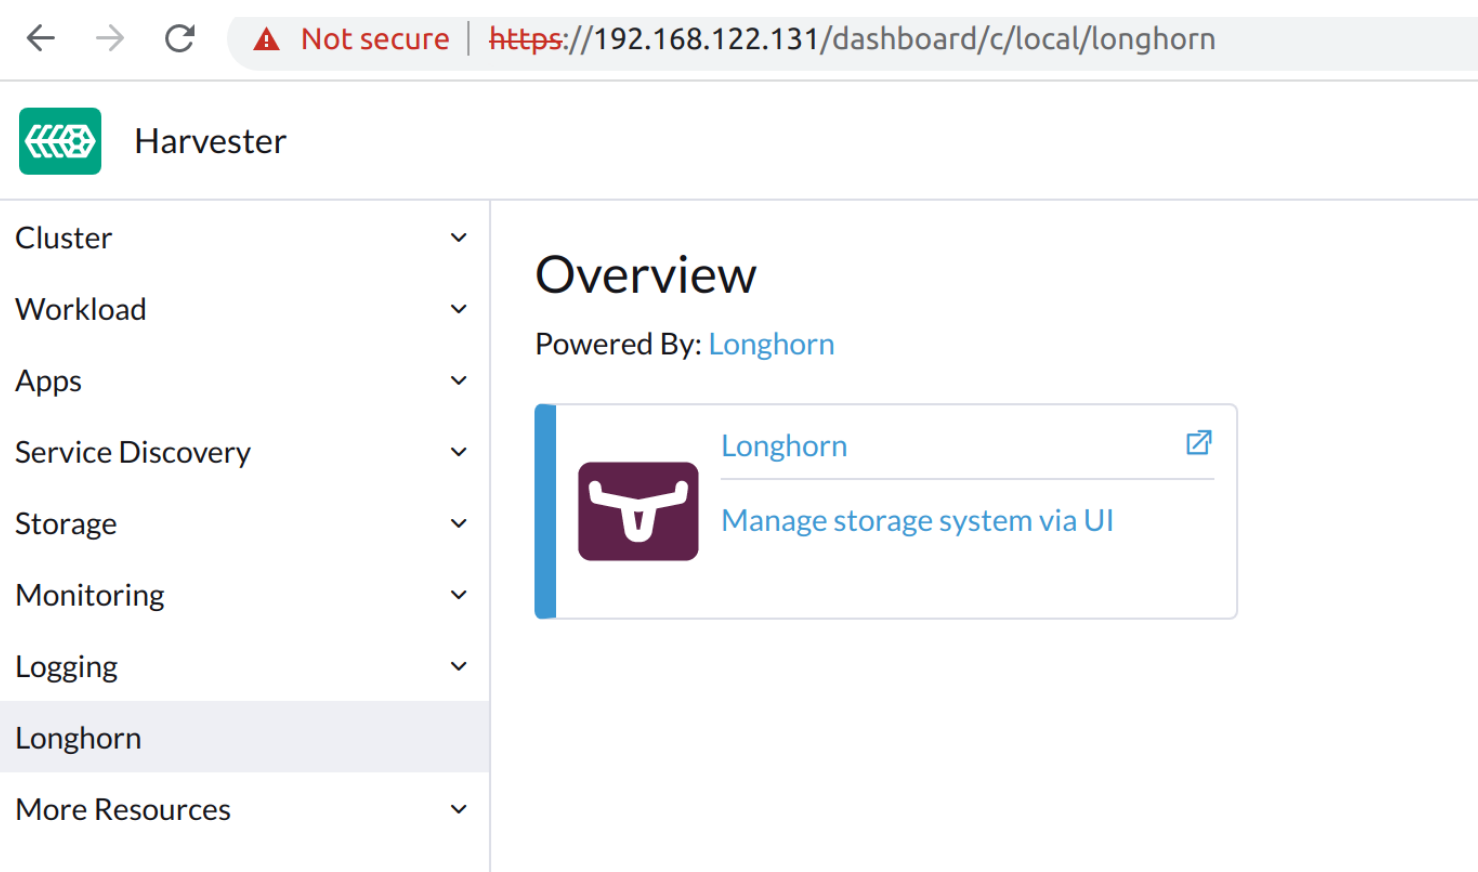
From Embedded Longhorn WebUI
Access the embedded Longhorn WebUI according to this document.
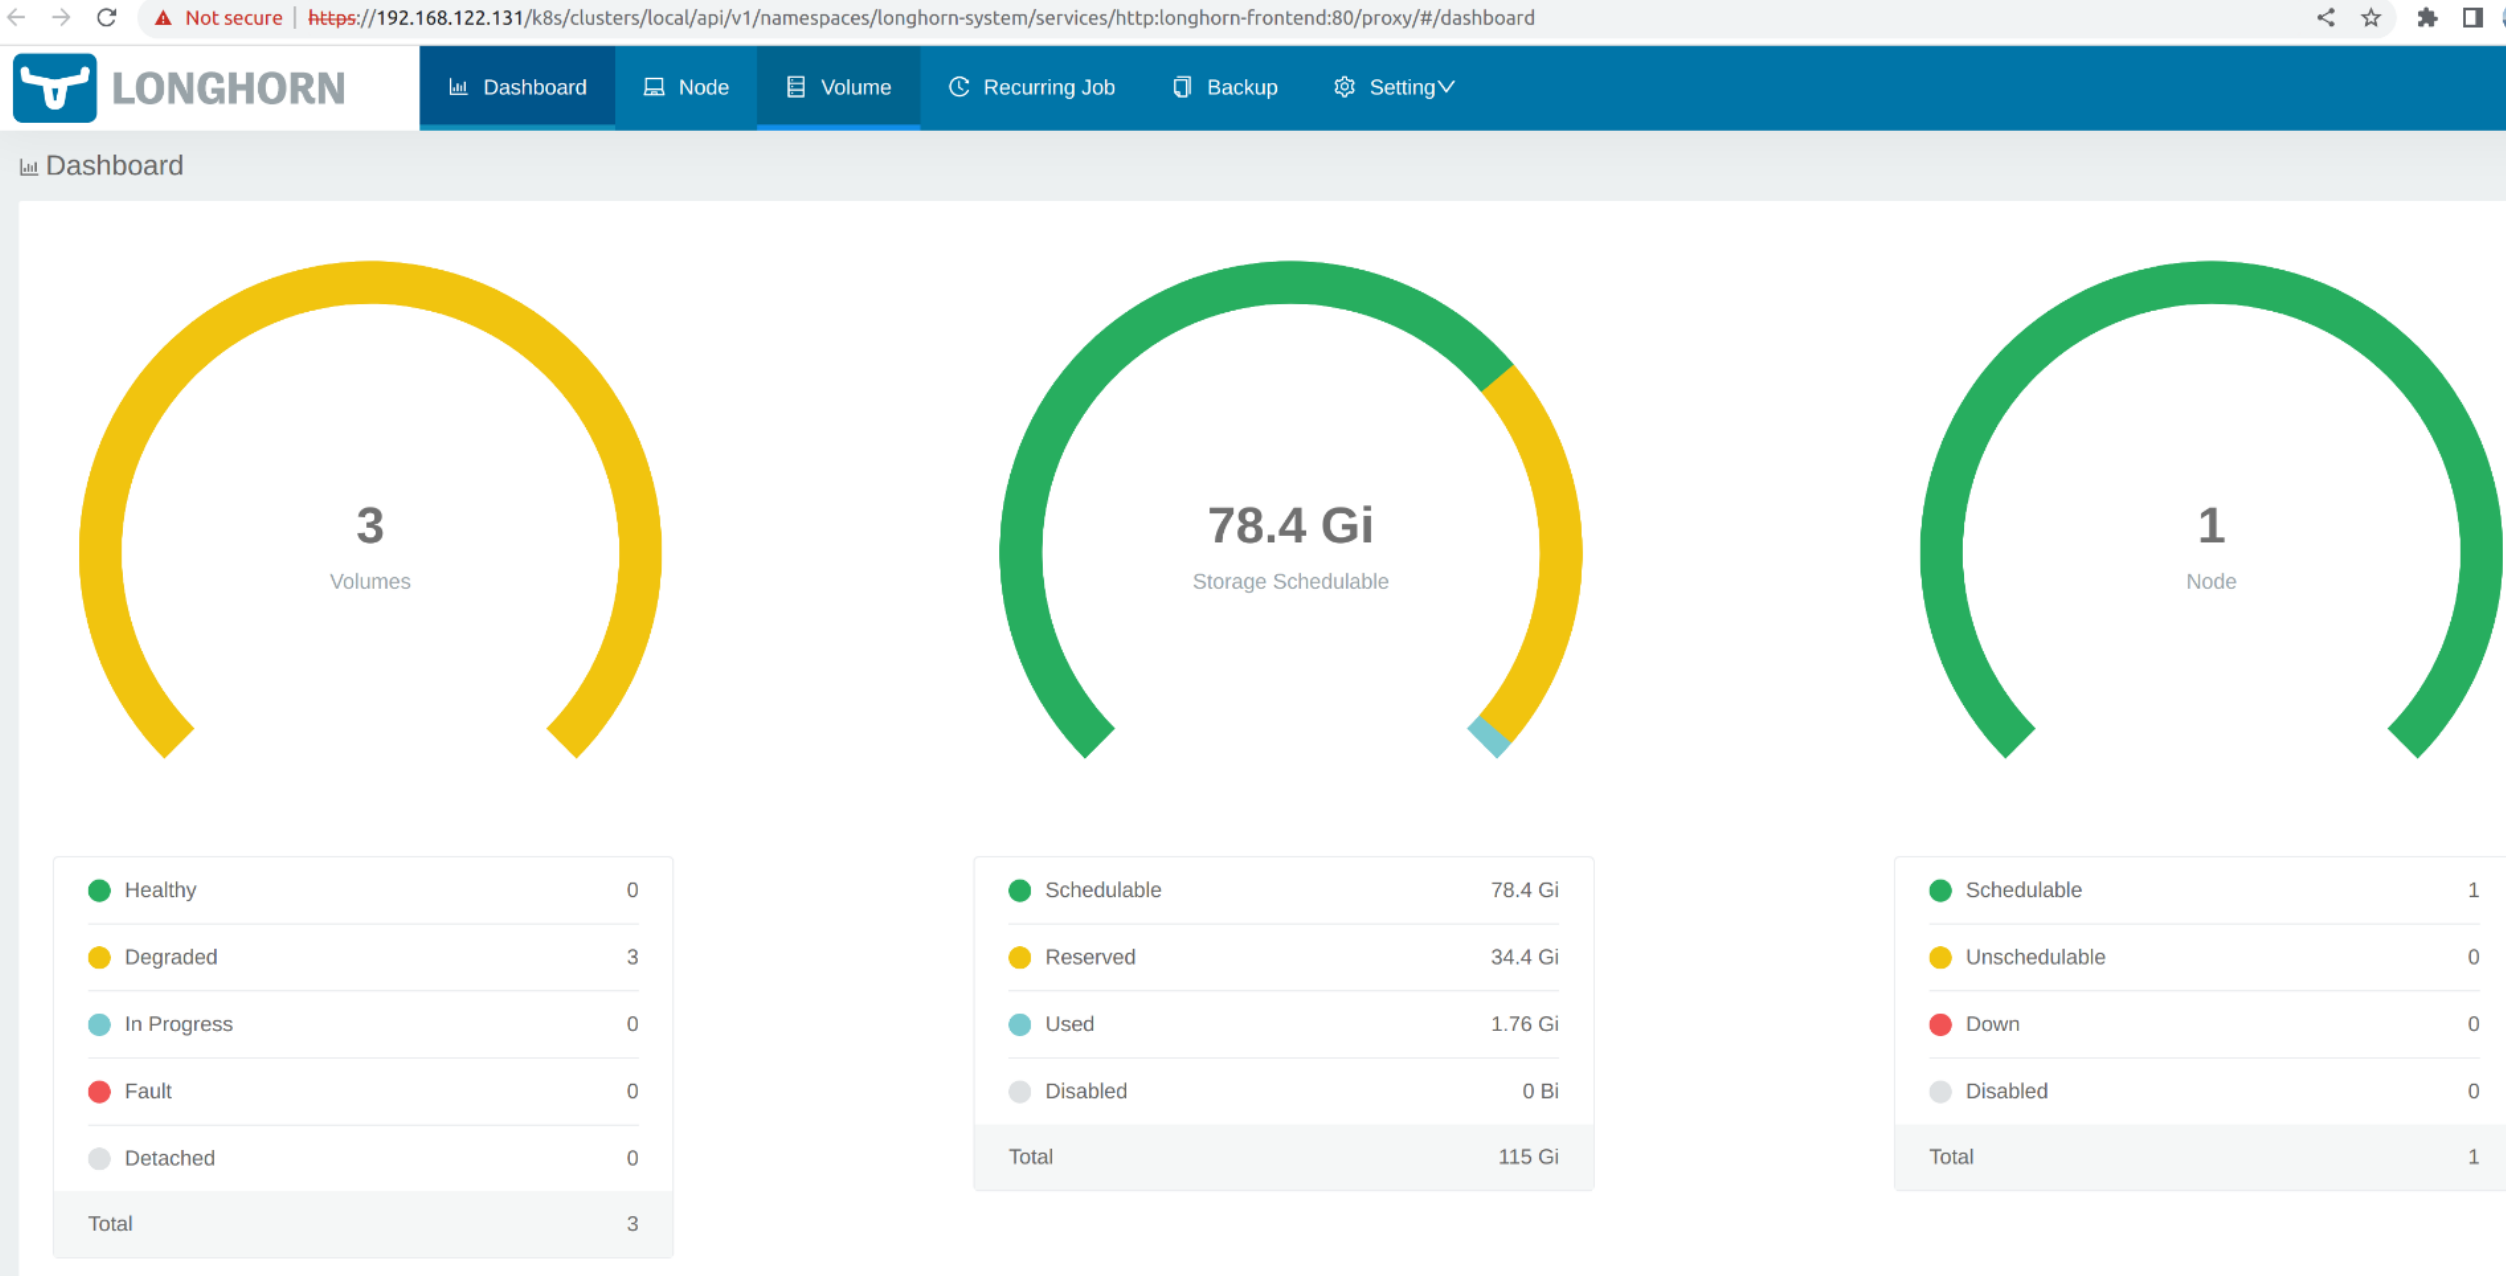
The default view.
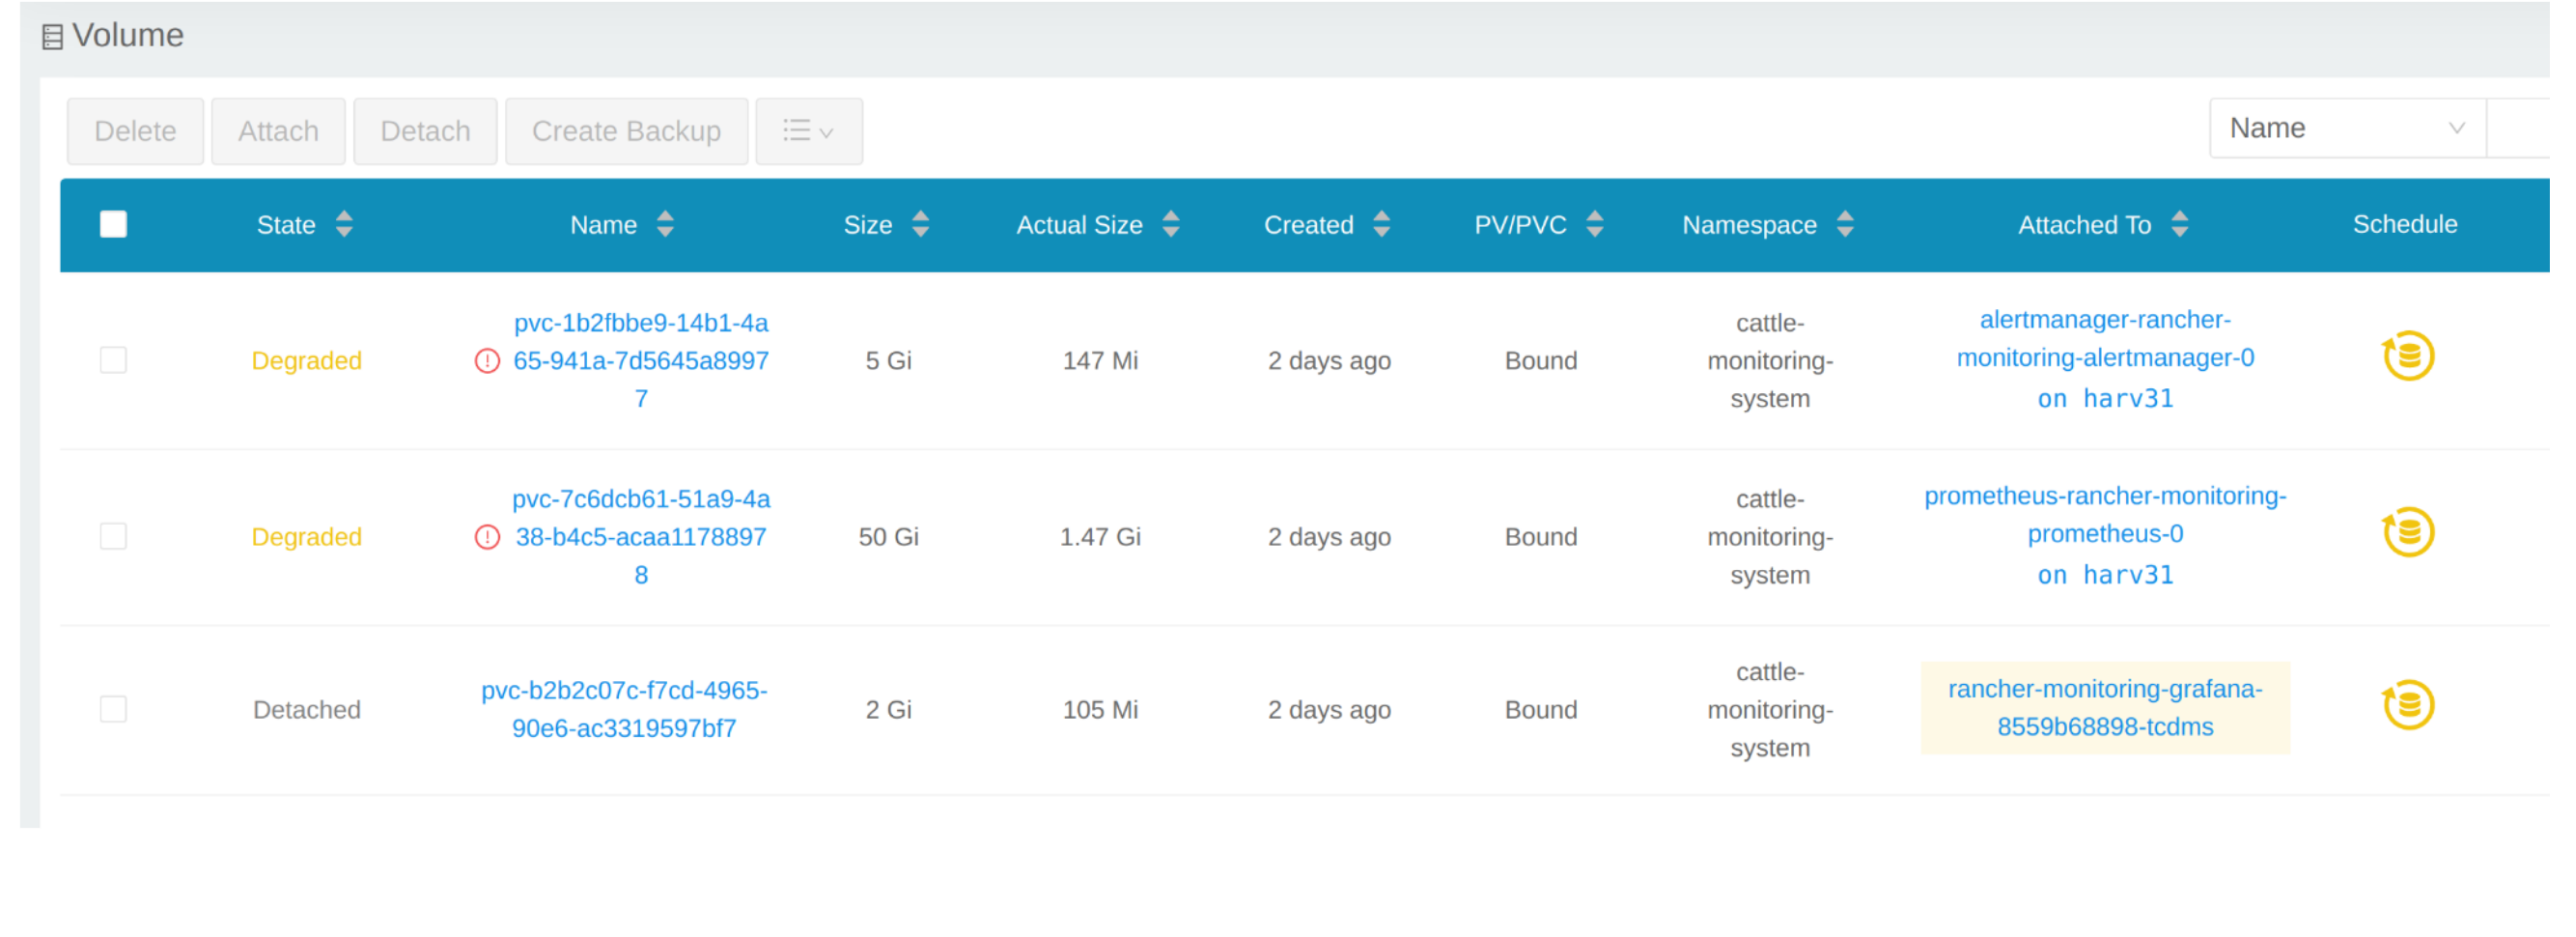
Click Volume to list all existing volumes.
From CLI
You can also use kubectl to get all Volumes.
# kubectl get pvc -A
NAMESPACE                  NAME                                                                                             STATUS   VOLUME                                     CAPACITY   ACCESS MODES   STORAGECLASS         AGE
cattle-monitoring-system   alertmanager-rancher-monitoring-alertmanager-db-alertmanager-rancher-monitoring-alertmanager-0   Bound    pvc-1b2fbbe9-14b1-4a65-941a-7d5645a89977   5Gi        RWO            harvester-longhorn   43h
cattle-monitoring-system   prometheus-rancher-monitoring-prometheus-db-prometheus-rancher-monitoring-prometheus-0           Bound    pvc-7c6dcb61-51a9-4a38-b4c5-acaa11788978   50Gi       RWO            harvester-longhorn   43h
cattle-monitoring-system   rancher-monitoring-grafana                                                                       Bound    pvc-b2b2c07c-f7cd-4965-90e6-ac3319597bf7   2Gi        RWO            harvester-longhorn   43h

# kubectl get volume -A
NAMESPACE         NAME                                       STATE      ROBUSTNESS   SCHEDULED   SIZE          NODE     AGE
longhorn-system   pvc-1b2fbbe9-14b1-4a65-941a-7d5645a89977   attached   degraded                 5368709120    harv31   43h
longhorn-system   pvc-7c6dcb61-51a9-4a38-b4c5-acaa11788978   attached   degraded                 53687091200   harv31   43h
longhorn-system   pvc-b2b2c07c-f7cd-4965-90e6-ac3319597bf7   attached   degraded                 2147483648    harv31   43h
Scale Down a Deployment
To detach the Volume, you need to scale down the deployment that uses the Volume.
The example below is against the PVC claimed by rancher-monitoring-grafana.
Find the deployment in the namespace cattle-monitoring-system.
# kubectl get deployment -n cattle-monitoring-system
NAME                                    READY   UP-TO-DATE   AVAILABLE   AGE
rancher-monitoring-grafana              1/1     1            1           43h  // target deployment
rancher-monitoring-kube-state-metrics   1/1     1            1           43h
rancher-monitoring-operator             1/1     1            1           43h
rancher-monitoring-prometheus-adapter   1/1     1            1           43h
Scale down the deployment rancher-monitoring-grafana to 0.
# kubectl scale --replicas=0 deployment/rancher-monitoring-grafana -n cattle-monitoring-system
Check the deployment and the volume.
# kubectl get deployment -n cattle-monitoring-system
NAME                                    READY   UP-TO-DATE   AVAILABLE   AGE
rancher-monitoring-grafana              0/0     0            0           43h  // scaled down
rancher-monitoring-kube-state-metrics   1/1     1            1           43h
rancher-monitoring-operator             1/1     1            1           43h
rancher-monitoring-prometheus-adapter   1/1     1            1           43h

# kubectl get volume -A
NAMESPACE         NAME                                       STATE      ROBUSTNESS   SCHEDULED   SIZE          NODE     AGE
longhorn-system   pvc-1b2fbbe9-14b1-4a65-941a-7d5645a89977   attached   degraded                 5368709120    harv31   43h
longhorn-system   pvc-7c6dcb61-51a9-4a38-b4c5-acaa11788978   attached   degraded                 53687091200   harv31   43h
longhorn-system   pvc-b2b2c07c-f7cd-4965-90e6-ac3319597bf7   detached   unknown                  2147483648             43h  // volume is detached
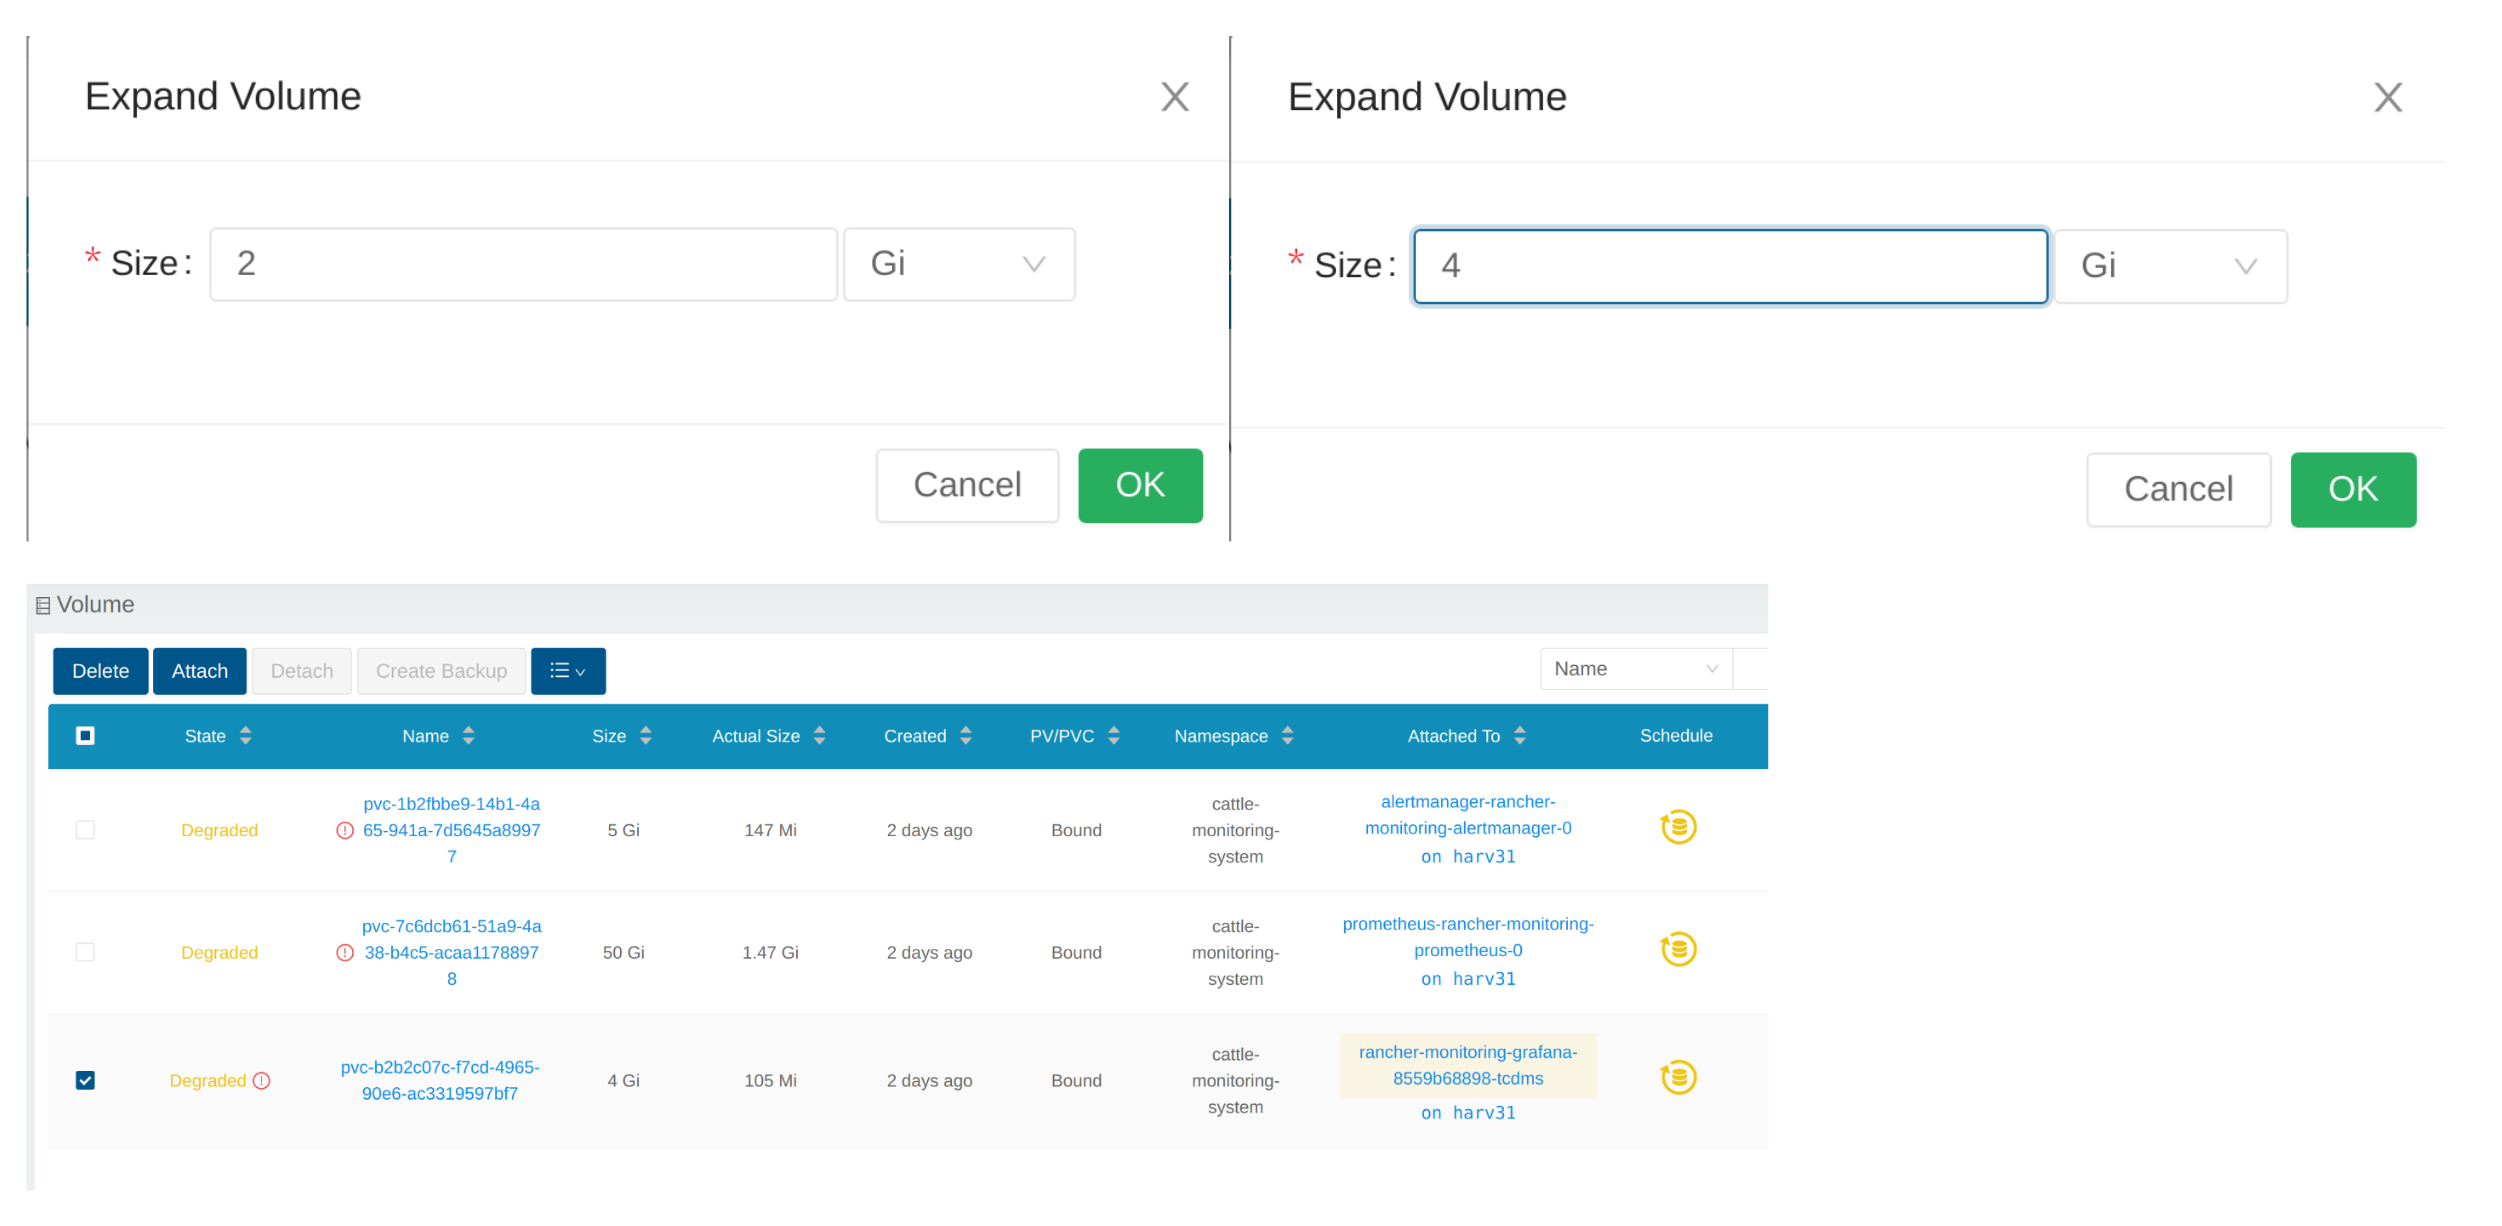
Expand Volume
In the Longhorn WebUI, the related volume becomes Detached. Click the icon in the Operation column, and select Expand Volume.
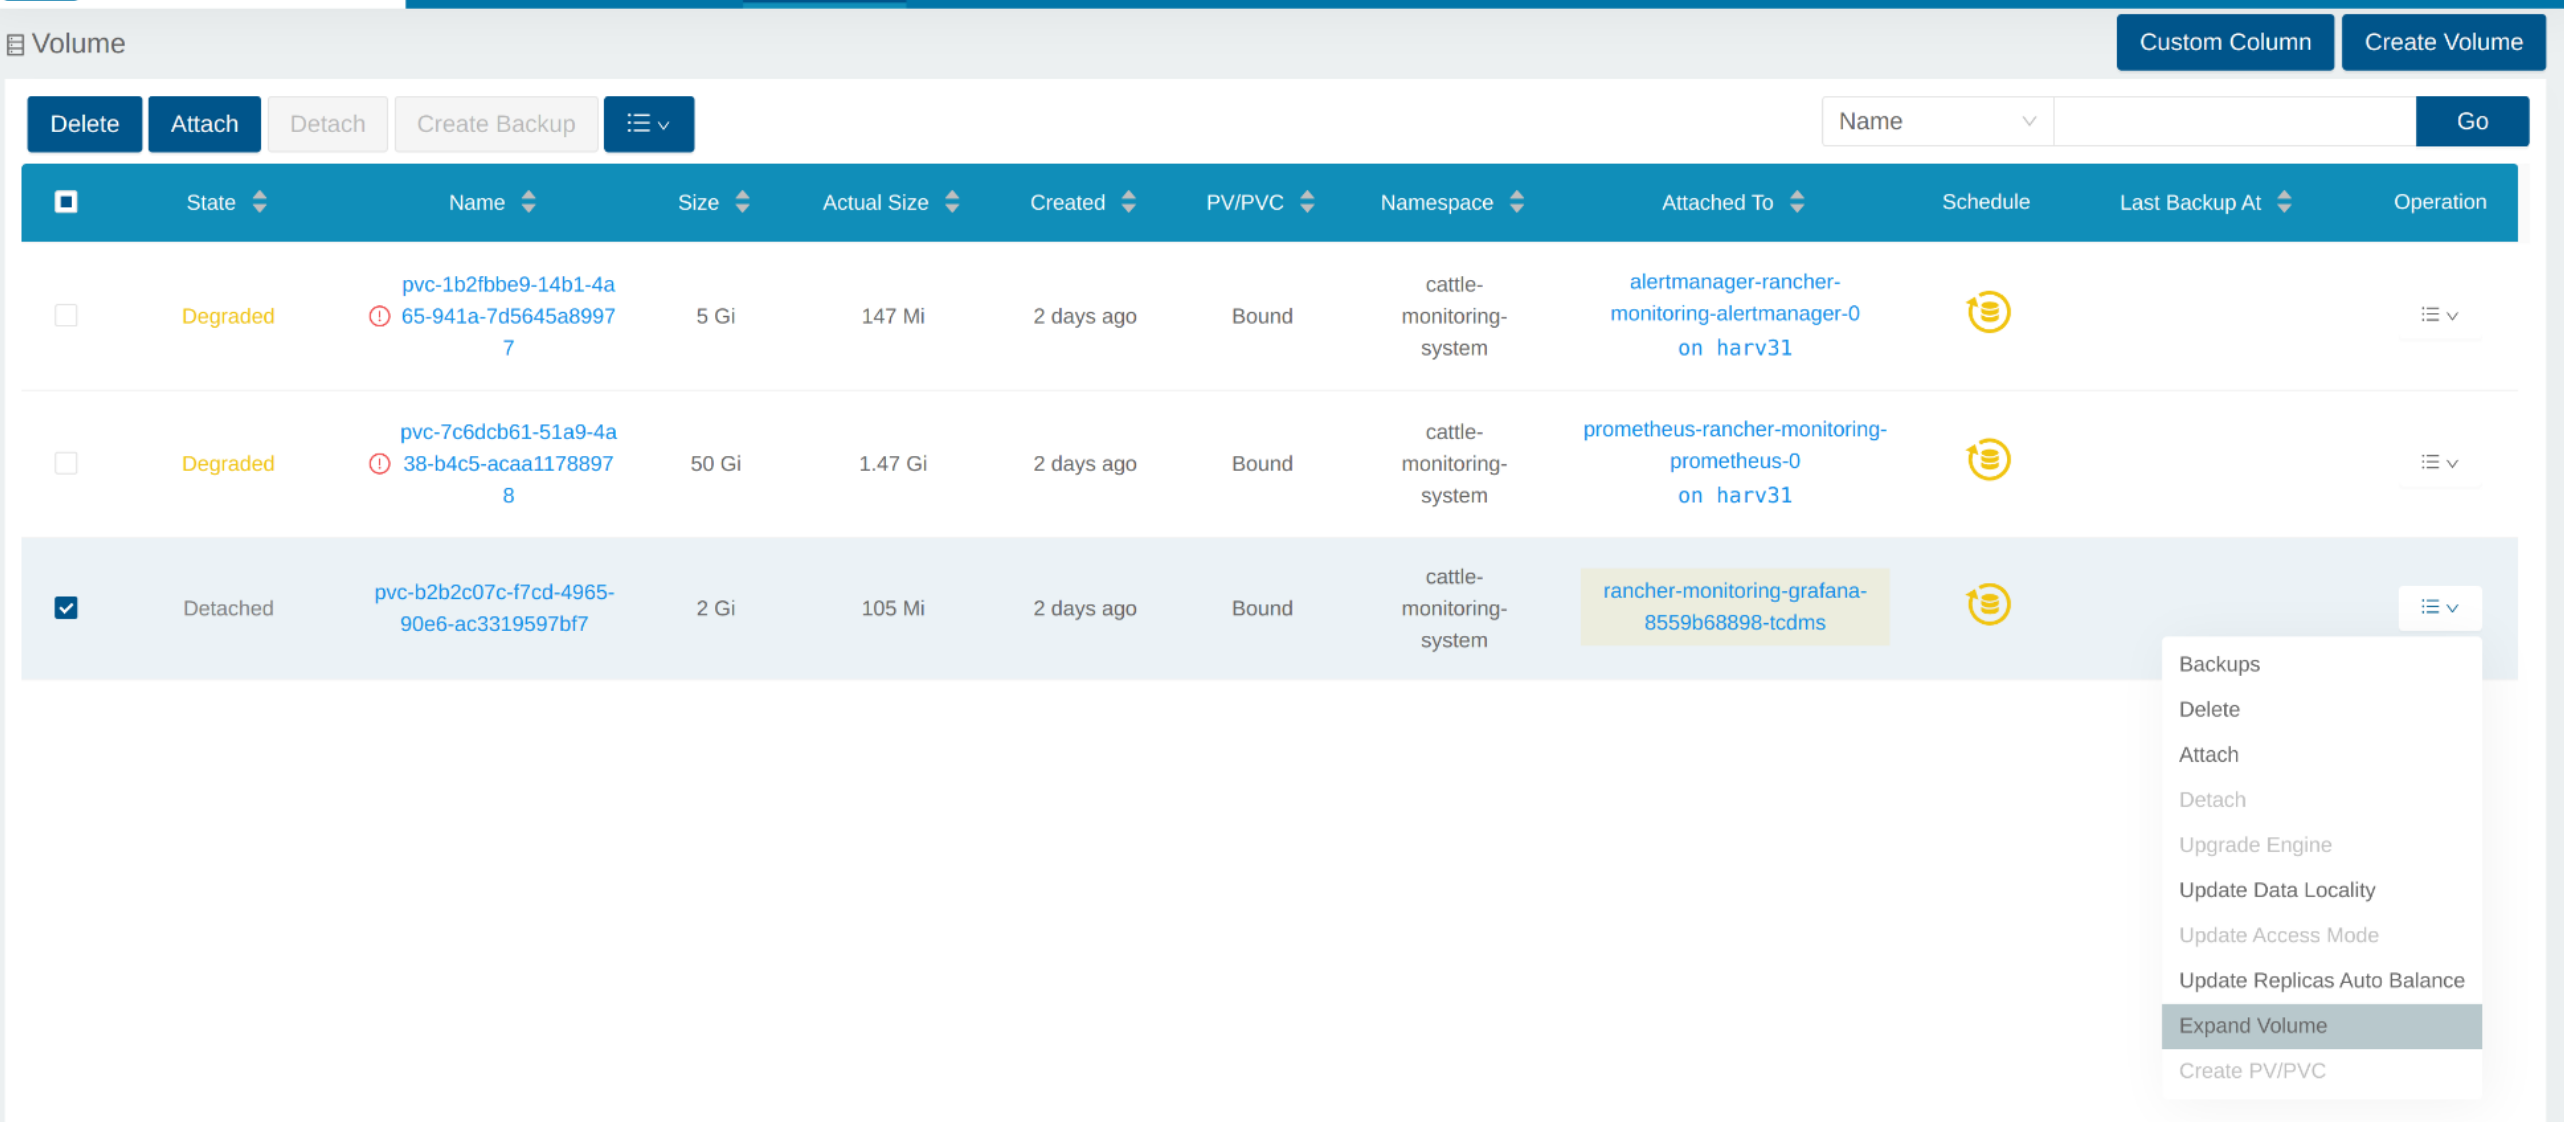
Input a new size, and Longhorn will expand the volume to this size.
Scale Up a Deployment
After the Volume is expanded to target size, you need to scale up the aforementioned deployment to its original replicas. For the above example of rancher-monitoring-grafana, the original replicas is 1.
# kubectl scale --replicas=1 deployment/rancher-monitoring-grafana -n cattle-monitoring-system
Check the deployment again.
# kubectl get deployment -n cattle-monitoring-system
NAME                                    READY   UP-TO-DATE   AVAILABLE   AGE
rancher-monitoring-grafana              1/1     1            1           43h  // scaled up
rancher-monitoring-kube-state-metrics   1/1     1            1           43h
rancher-monitoring-operator             1/1     1            1           43h
rancher-monitoring-prometheus-adapter   1/1     1            1           43h
The Volume is attached to the new POD.
To now, the Volume is expanded to the new size and the POD is using it smoothly.