Monitoring
The following sections contain tips to troubleshoot Harvester Monitoring.
Monitoring is unusable
When the Harvester Dashboard is not showing any monitoring metrics, it can be caused by the following reasons.
Monitoring is unusable due to Pod being stuck in Terminating status
Harvester Monitoring pods are deployed randomly on the cluster Nodes. When the Node hosting the pods accidentally goes down, the related pods may become stuck in the Terminating status rendering the Monitoring unusable from the WebUI.
$ kubectl get pods -n cattle-monitoring-system

NAMESPACE                   NAME                                                     READY   STATUS        RESTARTS   AGE
cattle-monitoring-system    prometheus-rancher-monitoring-prometheus-0               3/3     Terminating   0          3d23h
cattle-monitoring-system    rancher-monitoring-admission-create-fwjn9                0/1     Terminating   0          137m
cattle-monitoring-system    rancher-monitoring-crd-create-9wtzf                      0/1     Terminating   0          137m
cattle-monitoring-system    rancher-monitoring-grafana-d9c56d79b-ph4nz               3/3     Terminating   0          3d23h
cattle-monitoring-system    rancher-monitoring-grafana-d9c56d79b-t24sz               0/3     Init:0/2      0          132m

cattle-monitoring-system    rancher-monitoring-kube-state-metrics-5bc8bb48bd-nbd92   1/1     Running       4          4d1h
...
Monitoring can be recovered using CLI commands to force delete the related pods. The cluster will redeploy new pods to replace them.
# Delete each none-running Pod in namespace cattle-monitoring-system.

$ kubectl delete pod --force -n cattle-monitoring-system prometheus-rancher-monitoring-prometheus-0

 pod "prometheus-rancher-monitoring-prometheus-0" force deleted


$ kubectl delete pod --force -n cattle-monitoring-system rancher-monitoring-admission-create-fwjn9

$ kubectl delete pod --force -n cattle-monitoring-system rancher-monitoring-crd-create-9wtzf

$ kubectl delete pod --force -n cattle-monitoring-system rancher-monitoring-grafana-d9c56d79b-ph4nz

$ kubectl delete pod --force -n cattle-monitoring-system rancher-monitoring-grafana-d9c56d79b-t24sz
Wait for a few minutes so that the new pods are created and readied for the Monitoring dashboard to be usable again.
$ kubectl get pods -n cattle-monitoring-system

NAME                                                     READY   STATUS     RESTARTS   AGE
prometheus-rancher-monitoring-prometheus-0               0/3     Init:0/1   0          98s
rancher-monitoring-grafana-d9c56d79b-cp86w               0/3     Init:0/2   0          27s
...

$ kubectl get pods -n cattle-monitoring-system

NAME                                                     READY   STATUS    RESTARTS   AGE
prometheus-rancher-monitoring-prometheus-0               3/3     Running   0          7m57s
rancher-monitoring-grafana-d9c56d79b-cp86w               3/3     Running   0          6m46s
...
Expand PV/Volume Size
Harvester integrates Longhorn as the default storage provider.
Harvester Monitoring uses Persistent Volume (PV) to store running data. When a cluster has been running for a certain time, the Persistent Volume may need to expand its size.
Based on the Longhorn Volume expansion guide, Harvester illustrates how to expand the volume size.
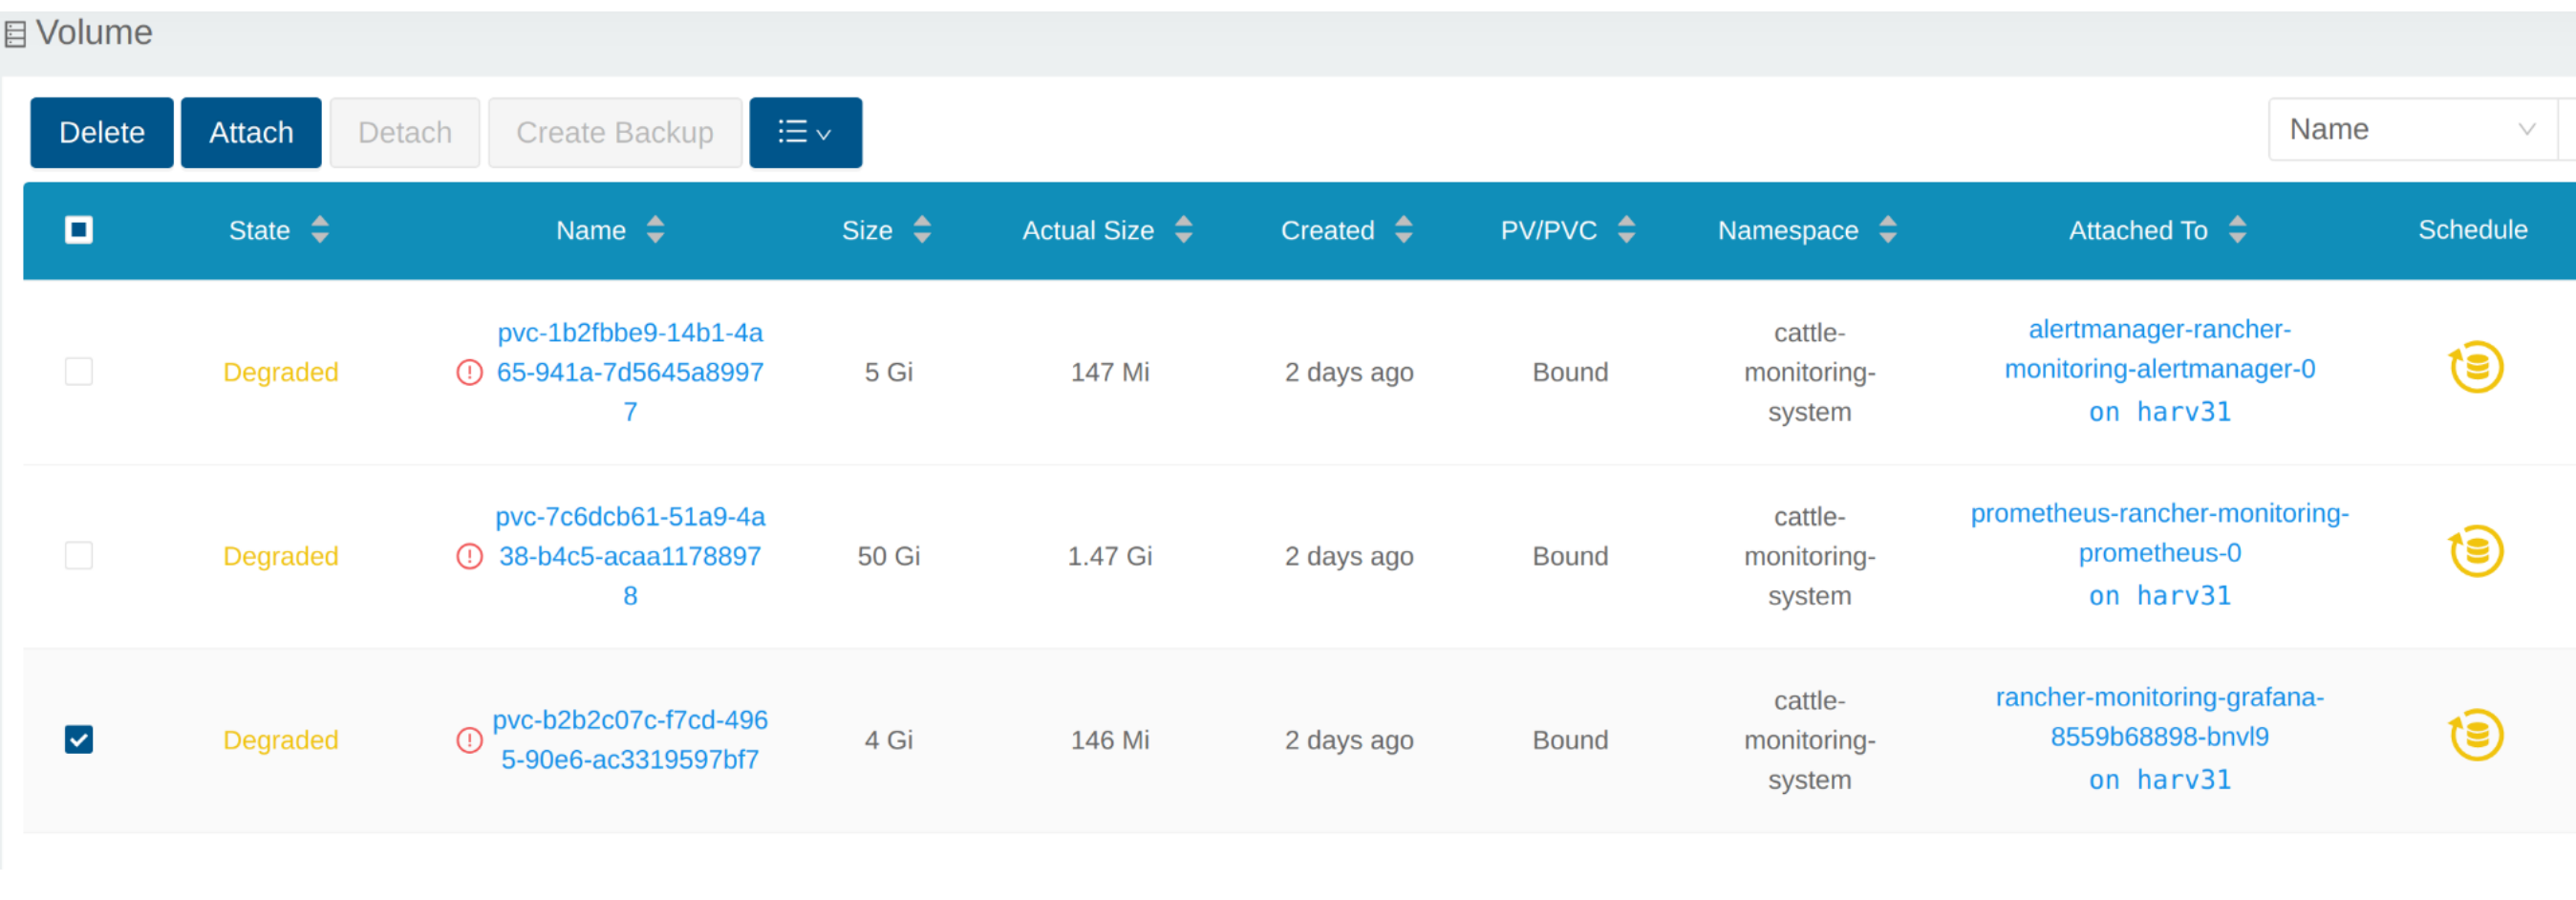
View Volume
From Embedded Longhorn WebUI
Access the embedded Longhorn WebUI according to this document.
The Longhorn dashboard default view.
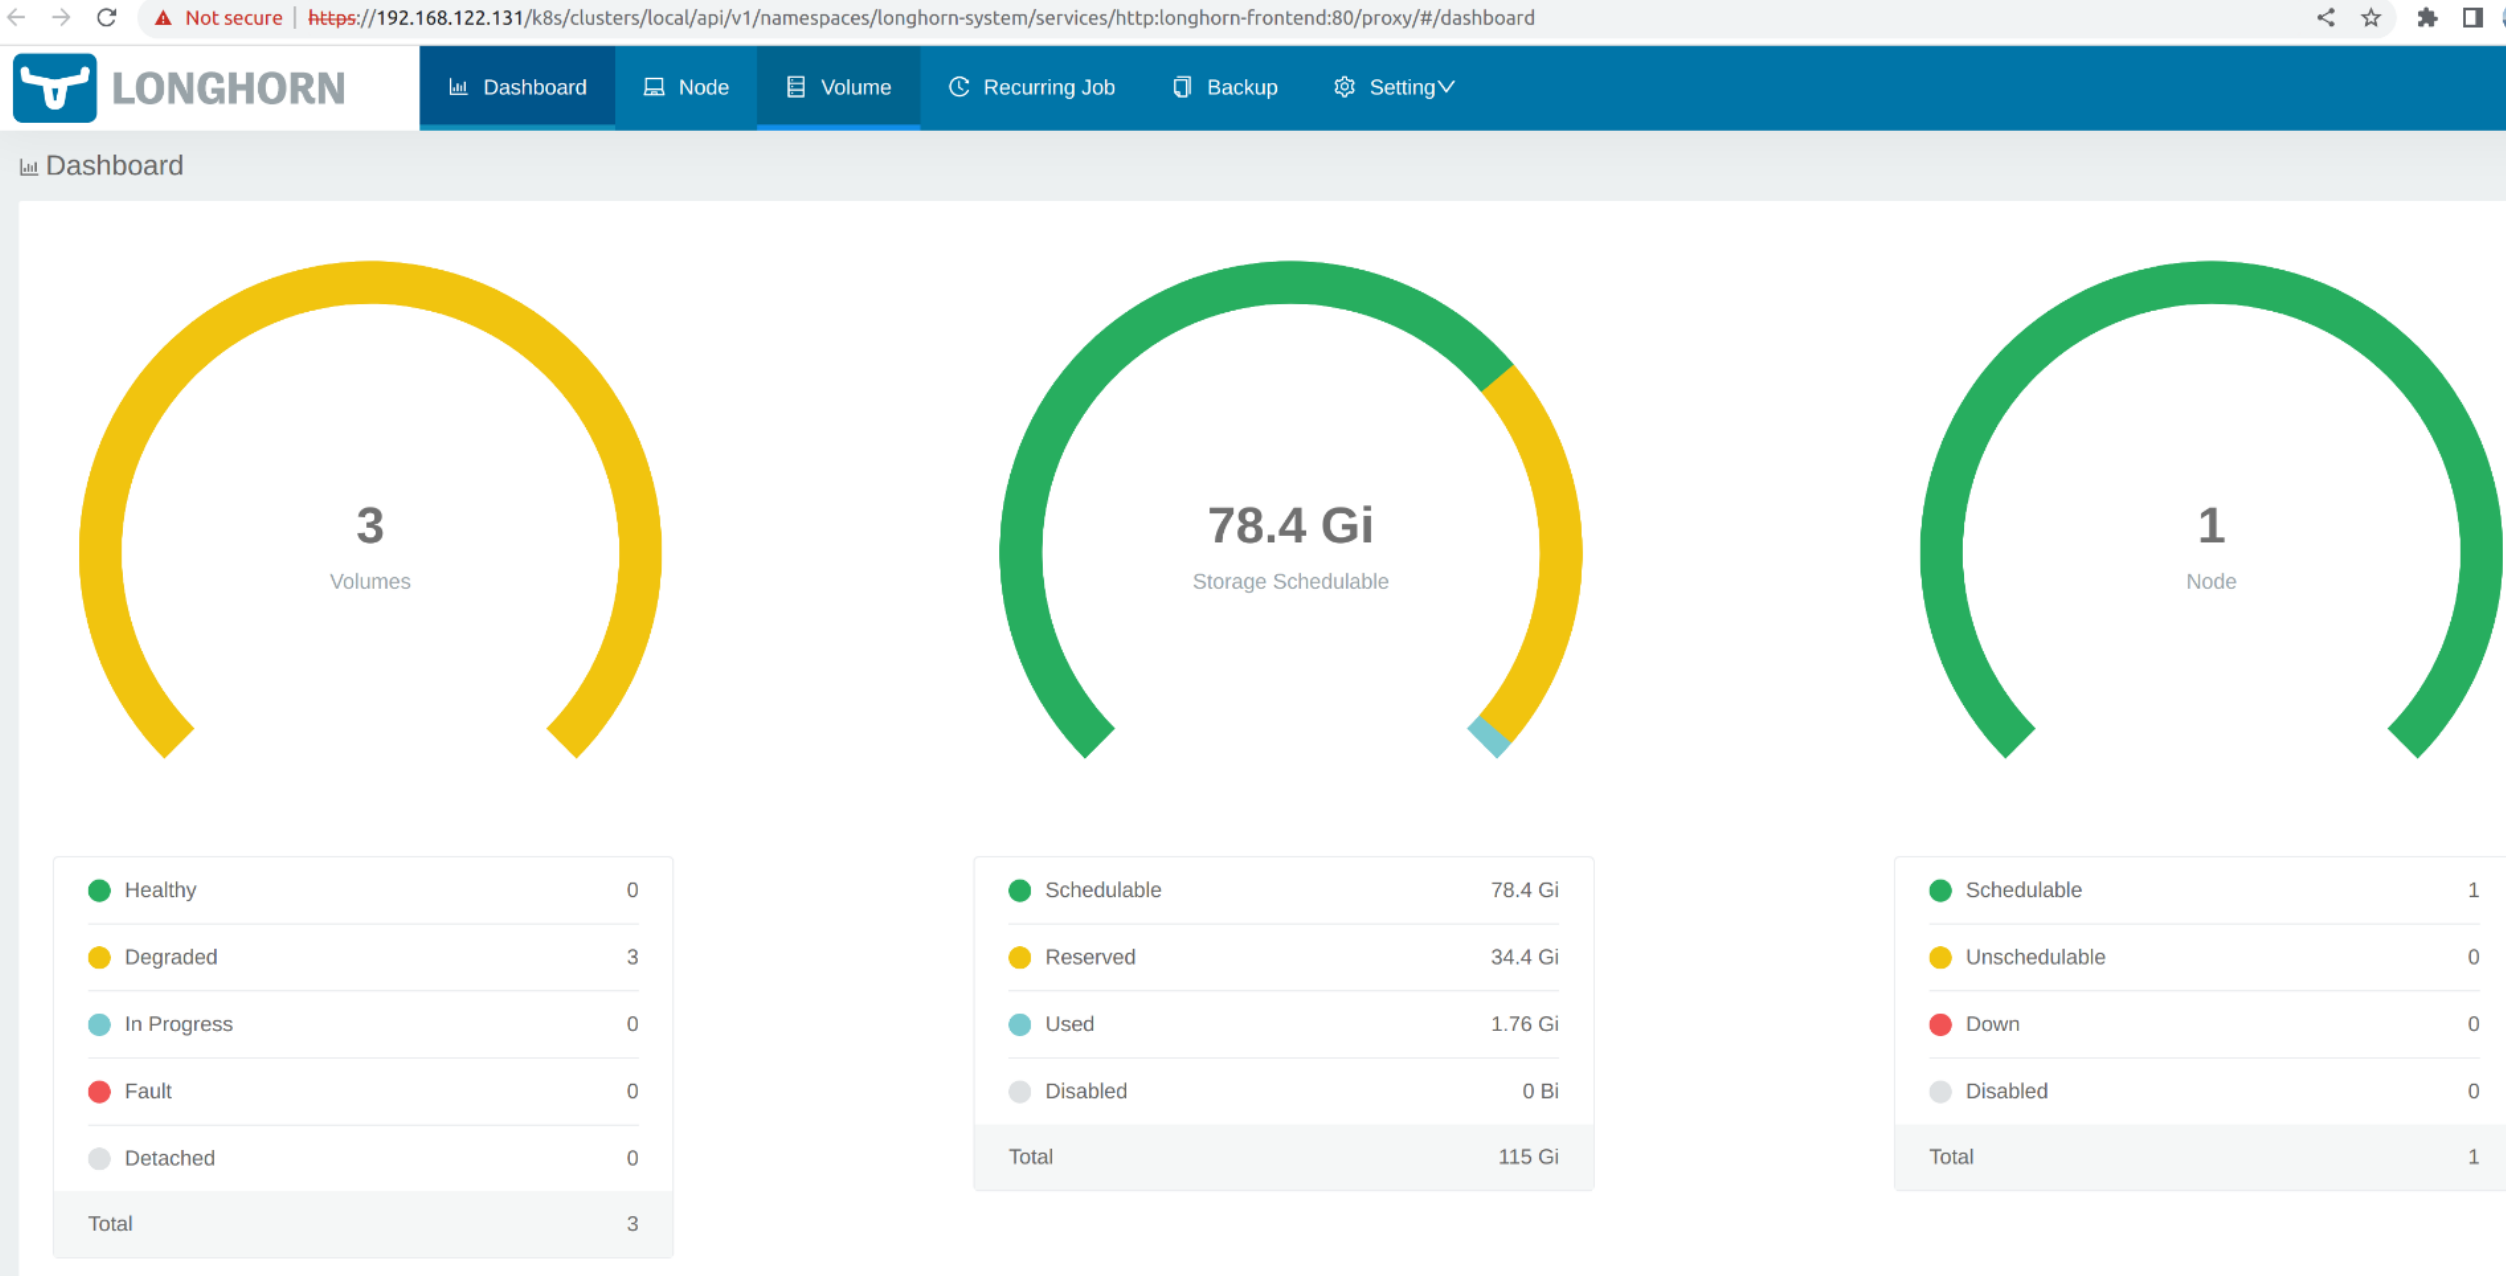
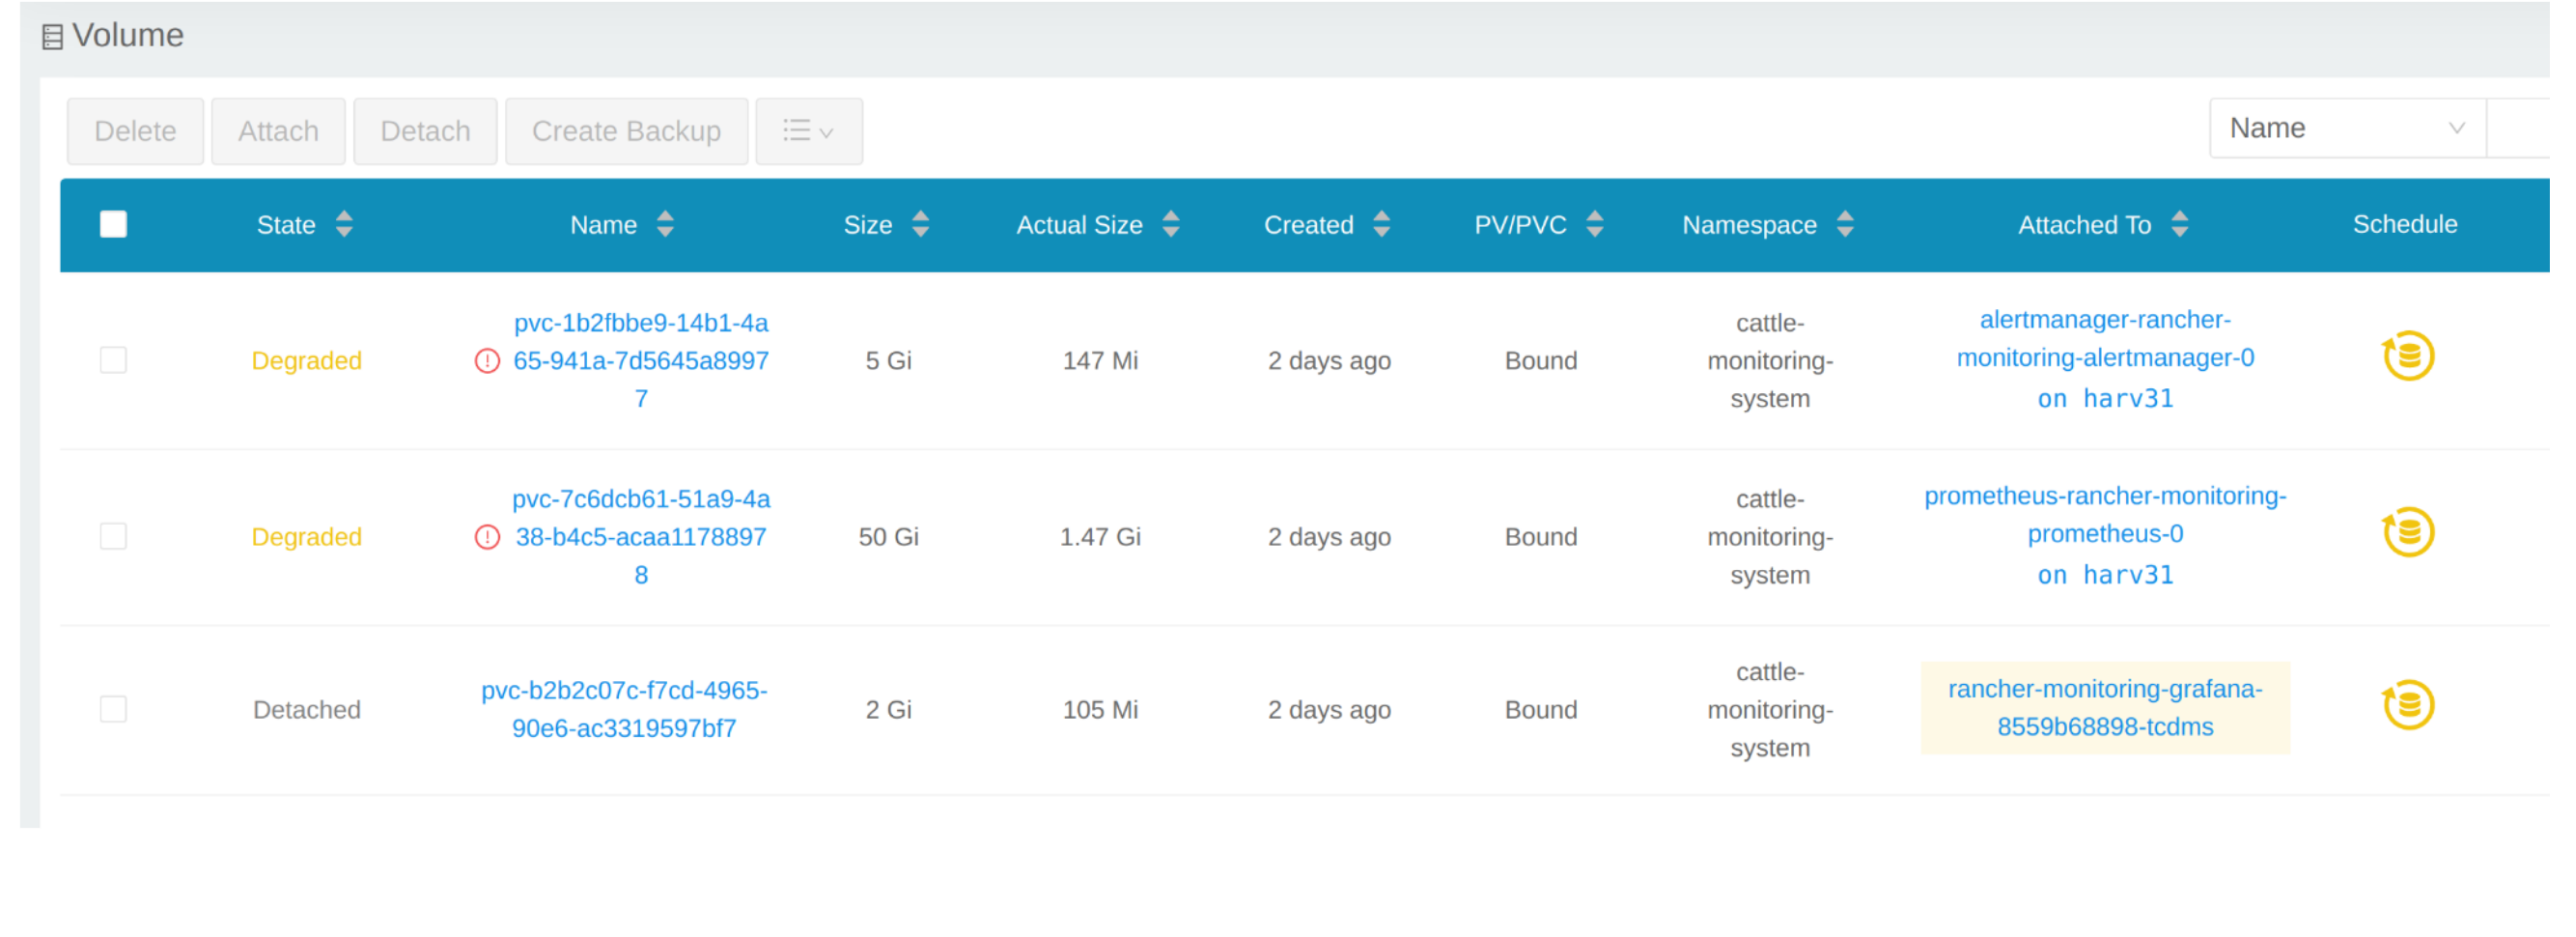
Click Volume to list all existing volumes.
From CLI
You can also use kubectl to get all Volumes.
# kubectl get pvc -A
NAMESPACE                  NAME                                                                                             STATUS   VOLUME                                     CAPACITY   ACCESS MODES   STORAGECLASS         AGE
cattle-monitoring-system   alertmanager-rancher-monitoring-alertmanager-db-alertmanager-rancher-monitoring-alertmanager-0   Bound    pvc-1b2fbbe9-14b1-4a65-941a-7d5645a89977   5Gi        RWO            harvester-longhorn   43h
cattle-monitoring-system   prometheus-rancher-monitoring-prometheus-db-prometheus-rancher-monitoring-prometheus-0           Bound    pvc-7c6dcb61-51a9-4a38-b4c5-acaa11788978   50Gi       RWO            harvester-longhorn   43h
cattle-monitoring-system   rancher-monitoring-grafana                                                                       Bound    pvc-b2b2c07c-f7cd-4965-90e6-ac3319597bf7   2Gi        RWO            harvester-longhorn   43h

# kubectl get volume -A
NAMESPACE         NAME                                       STATE      ROBUSTNESS   SCHEDULED   SIZE          NODE     AGE
longhorn-system   pvc-1b2fbbe9-14b1-4a65-941a-7d5645a89977   attached   degraded                 5368709120    harv31   43h
longhorn-system   pvc-7c6dcb61-51a9-4a38-b4c5-acaa11788978   attached   degraded                 53687091200   harv31   43h
longhorn-system   pvc-b2b2c07c-f7cd-4965-90e6-ac3319597bf7   attached   degraded                 2147483648    harv31   43h
Scale Down a Deployment
To detach the Volume, you need to scale down the deployment that uses the Volume.
The example below is against the PVC claimed by rancher-monitoring-grafana.
Find the deployment in the namespace cattle-monitoring-system.
# kubectl get deployment -n cattle-monitoring-system
NAME                                    READY   UP-TO-DATE   AVAILABLE   AGE
rancher-monitoring-grafana              1/1     1            1           43h  // target deployment
rancher-monitoring-kube-state-metrics   1/1     1            1           43h
rancher-monitoring-operator             1/1     1            1           43h
rancher-monitoring-prometheus-adapter   1/1     1            1           43h
Scale down the deployment rancher-monitoring-grafana to 0.
# kubectl scale --replicas=0 deployment/rancher-monitoring-grafana -n cattle-monitoring-system
Check the deployment and the volume.
# kubectl get deployment -n cattle-monitoring-system
NAME                                    READY   UP-TO-DATE   AVAILABLE   AGE
rancher-monitoring-grafana              0/0     0            0           43h  // scaled down
rancher-monitoring-kube-state-metrics   1/1     1            1           43h
rancher-monitoring-operator             1/1     1            1           43h
rancher-monitoring-prometheus-adapter   1/1     1            1           43h

# kubectl get volume -A
NAMESPACE         NAME                                       STATE      ROBUSTNESS   SCHEDULED   SIZE          NODE     AGE
longhorn-system   pvc-1b2fbbe9-14b1-4a65-941a-7d5645a89977   attached   degraded                 5368709120    harv31   43h
longhorn-system   pvc-7c6dcb61-51a9-4a38-b4c5-acaa11788978   attached   degraded                 53687091200   harv31   43h
longhorn-system   pvc-b2b2c07c-f7cd-4965-90e6-ac3319597bf7   detached   unknown                  2147483648             43h  // volume is detached
Expand Volume
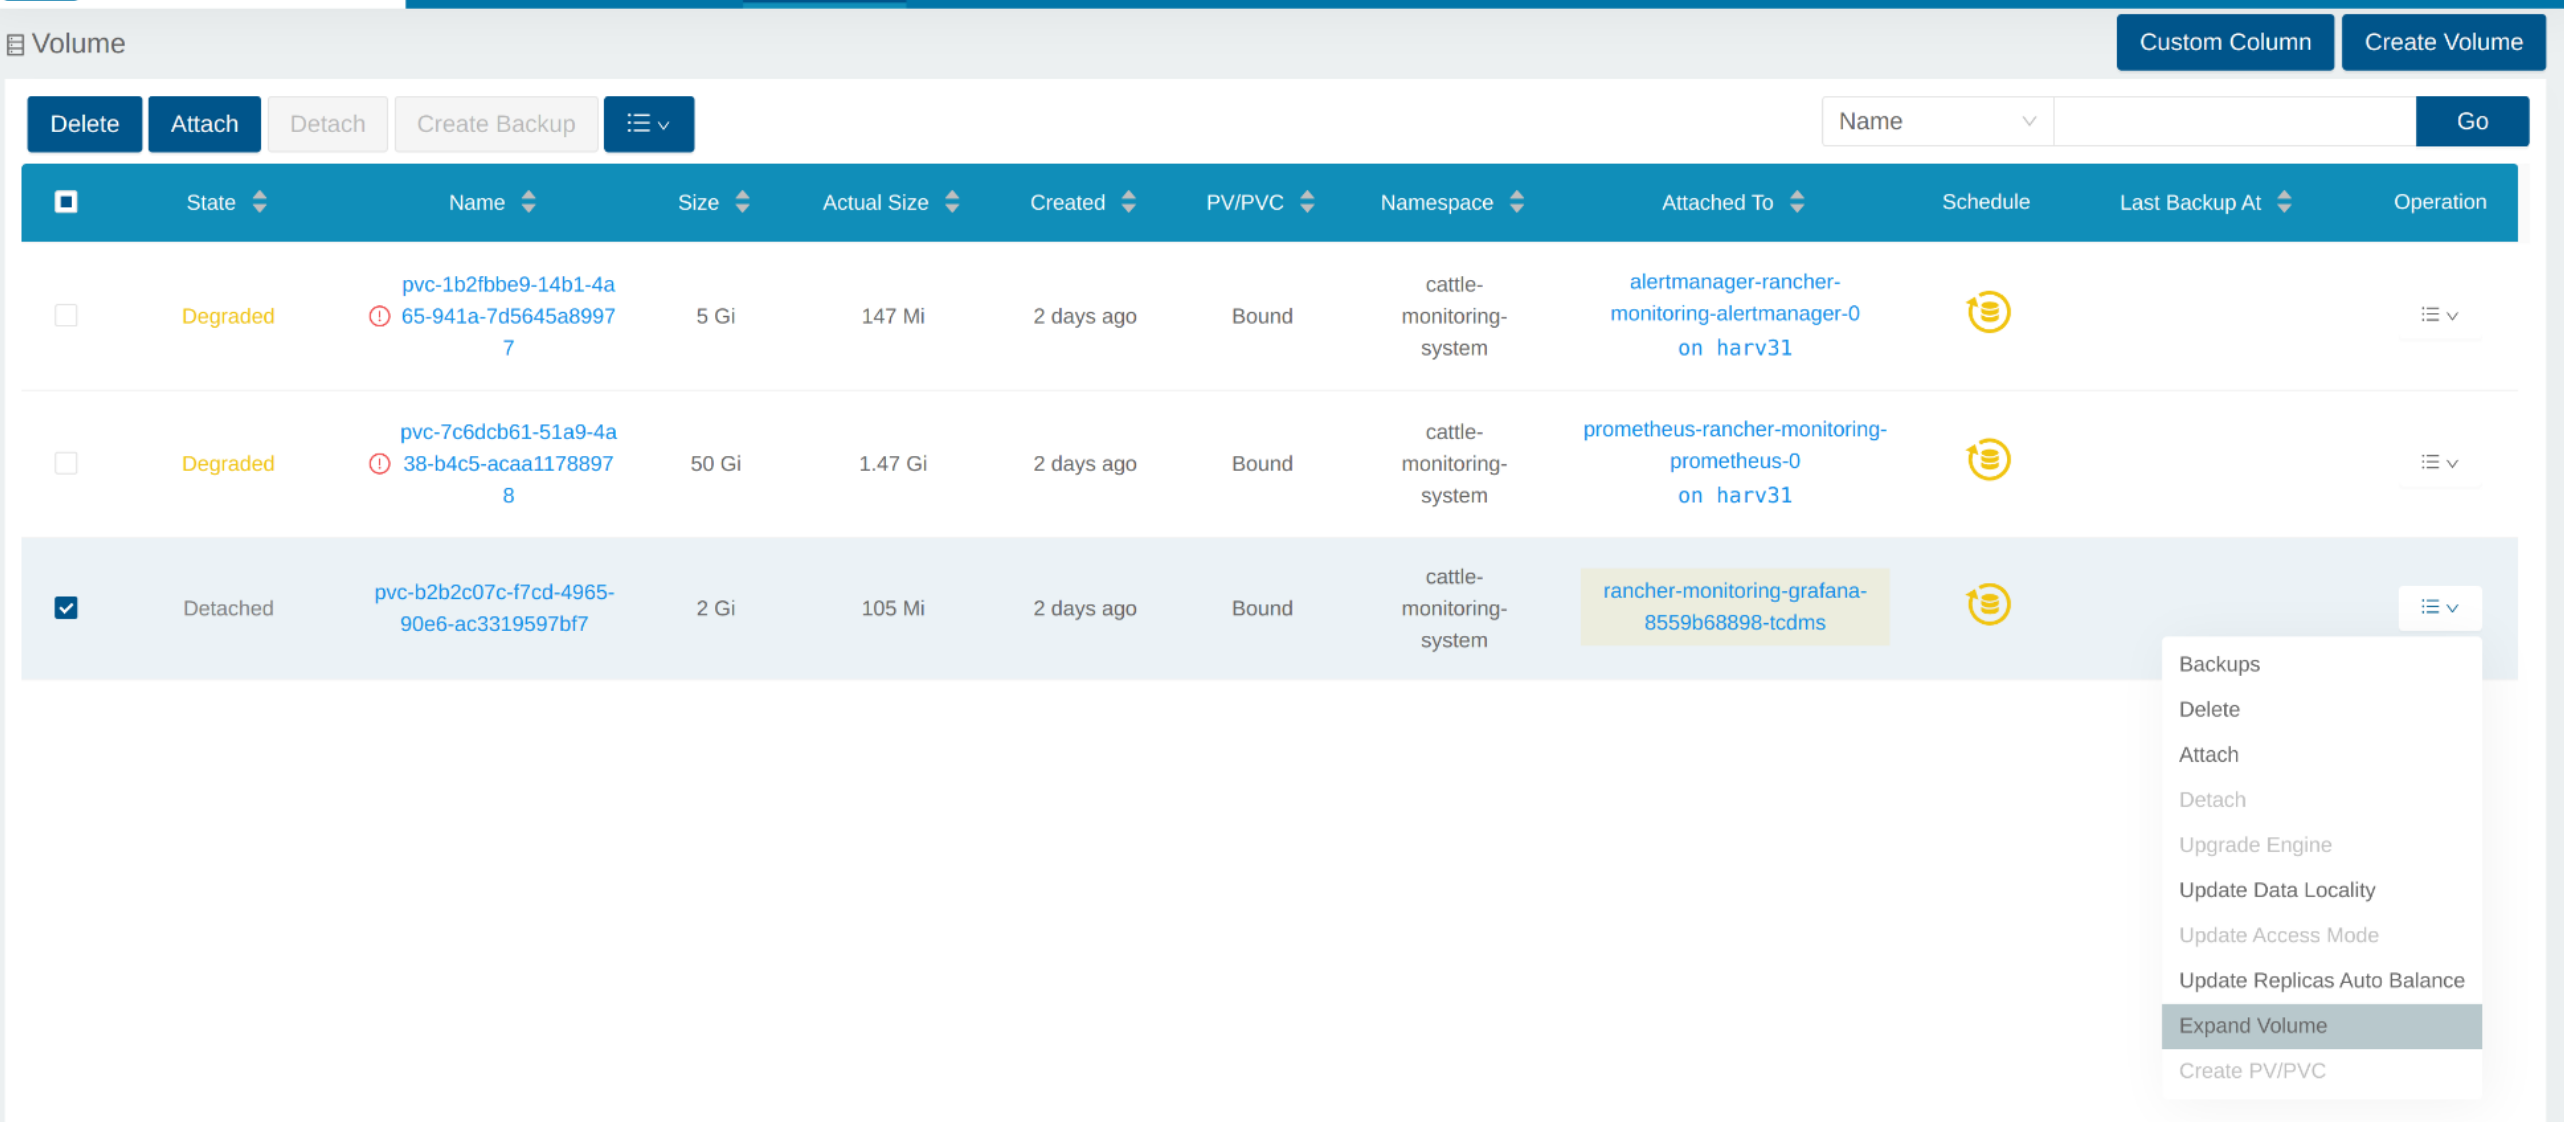
In the Longhorn WebUI, the related volume becomes Detached. Click the icon in the Operation column, and select Expand Volume.
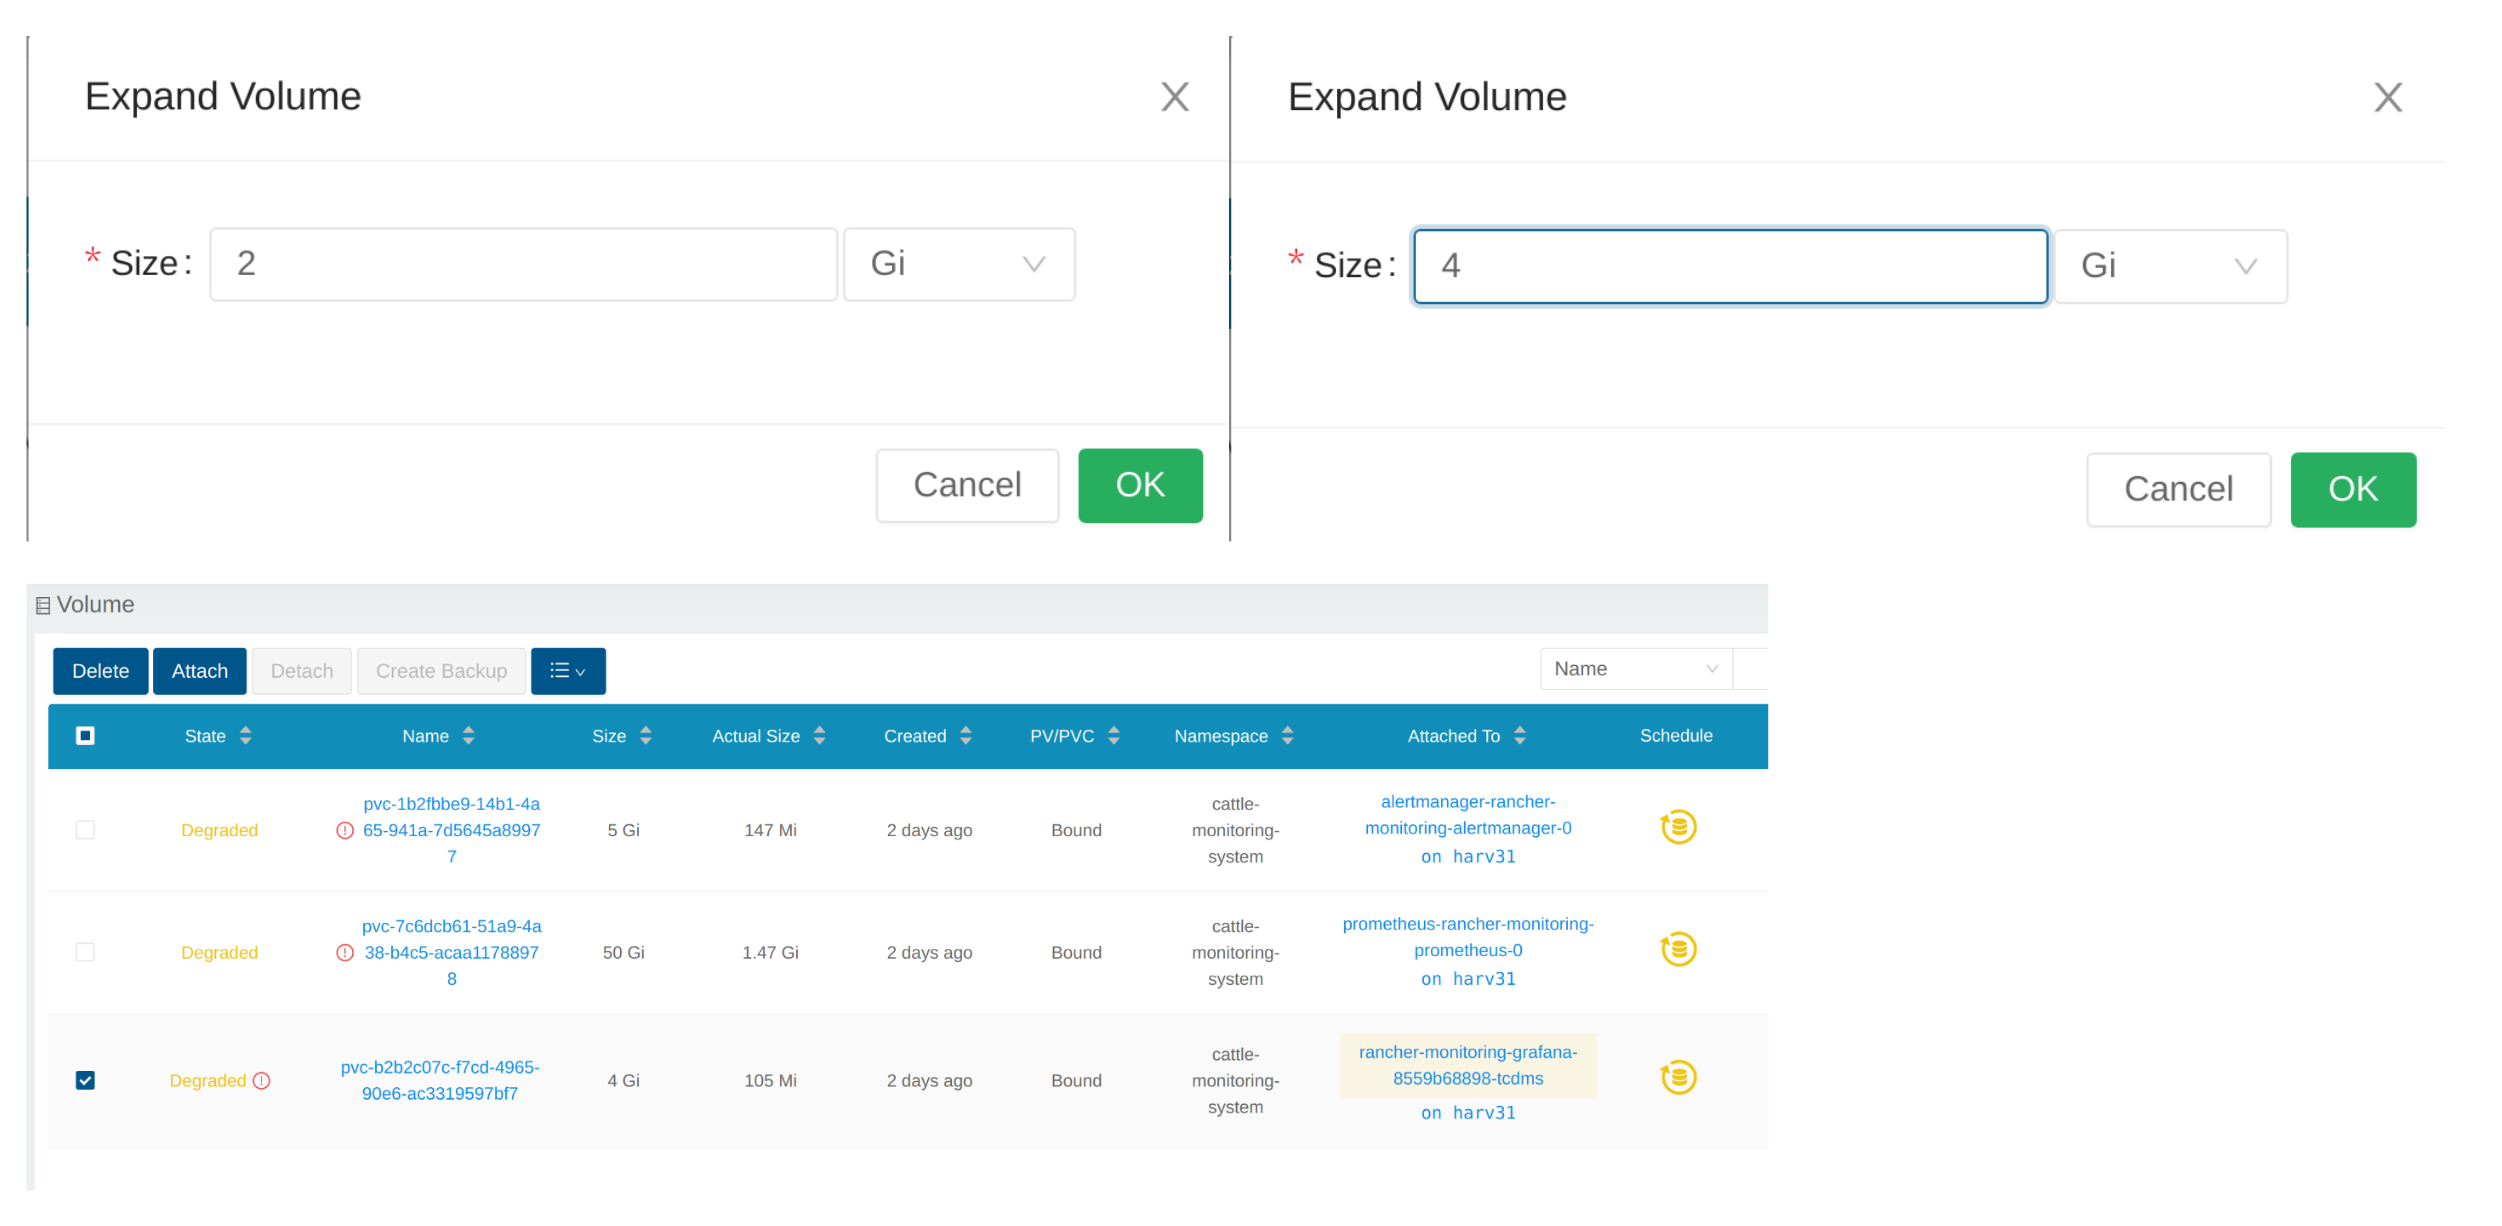
Input a new size, and Longhorn will expand the volume to this size.
Scale Up a Deployment
After the Volume is expanded to target size, you need to scale up the aforementioned deployment to its original replicas. For the above example of rancher-monitoring-grafana, the original replicas is 1.
# kubectl scale --replicas=1 deployment/rancher-monitoring-grafana -n cattle-monitoring-system
Check the deployment again.
# kubectl get deployment -n cattle-monitoring-system
NAME                                    READY   UP-TO-DATE   AVAILABLE   AGE
rancher-monitoring-grafana              1/1     1            1           43h  // scaled up
rancher-monitoring-kube-state-metrics   1/1     1            1           43h
rancher-monitoring-operator             1/1     1            1           43h
rancher-monitoring-prometheus-adapter   1/1     1            1           43h
The Volume is attached to the new POD.
To now, the Volume is expanded to the new size and the POD is using it smoothly.
Fail to Enable rancher-monitoring Addon
You may encounter this when you install the Harvester v1.3.0 or higher version cluster with the minimal 250 GB disk per hardware requirements.
Reproduce Steps
-
Install the Harvester v1.3.0 cluster.
-
Enable the
rancher-monitoringaddon, you will observe:
-
The POD
prometheus-rancher-monitoring-prometheus-0incattle-monitoring-systemnamespace fails to start due to PVC attached failed.$ kubectl get pods -n cattle-monitoring-system
NAME READY STATUS RESTARTS AGE
alertmanager-rancher-monitoring-alertmanager-0 2/2 Running 0 3m22s
helm-install-rancher-monitoring-4b5mx 0/1 Completed 0 3m41s
prometheus-rancher-monitoring-prometheus-0 0/3 Init:0/1 0 3m21s // stuck in this status
rancher-monitoring-grafana-d6f466988-hgpkb 4/4 Running 0 3m26s
rancher-monitoring-kube-state-metrics-7659b76cc4-66sr7 1/1 Running 0 3m26s
rancher-monitoring-operator-595476bc84-7hdxj 1/1 Running 0 3m25s
rancher-monitoring-prometheus-adapter-55dc9ccd5d-pcrpk 1/1 Running 0 3m26s
rancher-monitoring-prometheus-node-exporter-pbzv4 1/1 Running 0 3m26s
$ kubectl describe pod -n cattle-monitoring-system prometheus-rancher-monitoring-prometheus-0
Name: prometheus-rancher-monitoring-prometheus-0
Namespace: cattle-monitoring-system
Priority: 0
Service Account: rancher-monitoring-prometheus
...
Events:
Type Reason Age From Message
---- ------ ---- ---- -------
Warning FailedScheduling 3m48s (x3 over 4m15s) default-scheduler 0/1 nodes are available: pod has unbound immediate PersistentVolumeClaims. preemption: 0/1 nodes are available: 1 Preemption is not helpful for scheduling..
Normal Scheduled 3m44s default-scheduler Successfully assigned cattle-monitoring-system/prometheus-rancher-monitoring-prometheus-0 to harv41
Warning FailedMount 101s kubelet Unable to attach or mount volumes: unmounted volumes=[prometheus-rancher-monitoring-prometheus-db], unattached volumes=[prometheus-rancher-monitoring-prometheus-db], failed to process volumes=[]: timed out waiting for the condition
Warning FailedAttachVolume 90s (x9 over 3m42s) attachdetach-controller AttachVolume.Attach failed for volume "pvc-bbe8760d-926c-484a-851c-b8ec29ae05c0" : rpc error: code = Aborted desc = volume pvc-bbe8760d-926c-484a-851c-b8ec29ae05c0 is not ready for workloads
$ kubectl get pvc -A
NAMESPACE NAME STATUS VOLUME CAPACITY ACCESS MODES STORAGECLASS AGE
cattle-monitoring-system prometheus-rancher-monitoring-prometheus-db-prometheus-rancher-monitoring-prometheus-0 Bound pvc-bbe8760d-926c-484a-851c-b8ec29ae05c0 50Gi RWO harvester-longhorn 7m12s
$ kubectl get volume -A
NAMESPACE NAME DATA ENGINE STATE ROBUSTNESS SCHEDULED SIZE NODE AGE
longhorn-system pvc-bbe8760d-926c-484a-851c-b8ec29ae05c0 v1 detached unknown 53687091200 6m55s -
The Longhorn manager is unable to schedule the replica.
$ kubectl logs -n longhorn-system longhorn-manager-bf65b | grep "pvc-bbe8760d-926c-484a-851c-b8ec29ae05c0"

time="2024-02-19T10:12:56Z" level=error msg="There's no available disk for replica pvc-bbe8760d-926c-484a-851c-b8ec29ae05c0-r-dcb129fd, size 53687091200" func="schedule
r.(*ReplicaScheduler).ScheduleReplica" file="replica_scheduler.go:95"
time="2024-02-19T10:12:56Z" level=warning msg="Failed to schedule replica" func="controller.(*VolumeController).reconcileVolumeCondition" file="volume_controller.go:169
4" accessMode=rwo controller=longhorn-volume frontend=blockdev migratable=false node=harv41 owner=harv41 replica=pvc-bbe8760d-926c-484a-851c-b8ec29ae05c0-r-dcb129fd sta
te= volume=pvc-bbe8760d-926c-484a-851c-b8ec29ae05c0
...
Workaround
-
Disable the
rancher-monitoringaddon if you have already enabled it.All pods in
cattle-monitoring-systemare deleted but the PVCs are retained. For more information, see [Addons].$ kubectl get pods -n cattle-monitoring-system
No resources found in cattle-monitoring-system namespace.
$ kubectl get pvc -n cattle-monitoring-system
NAME STATUS VOLUME CAPACITY ACCESS MODES STORAGECLASS AGE
alertmanager-rancher-monitoring-alertmanager-db-alertmanager-rancher-monitoring-alertmanager-0 Bound pvc-cea6316e-f74f-4771-870b-49edb5442819 5Gi RWO harvester-longhorn 14m
prometheus-rancher-monitoring-prometheus-db-prometheus-rancher-monitoring-prometheus-0 Bound pvc-bbe8760d-926c-484a-851c-b8ec29ae05c0 50Gi RWO harvester-longhorn 14m -
Delete the PVC named
prometheus, but retain the PVC namedalertmanager.$ kubectl delete pvc -n cattle-monitoring-system prometheus-rancher-monitoring-prometheus-db-prometheus-rancher-monitoring-prometheus-0
persistentvolumeclaim "prometheus-rancher-monitoring-prometheus-db-prometheus-rancher-monitoring-prometheus-0" deleted
$ kubectl get pvc -n cattle-monitoring-system
NAME STATUS VOLUME CAPACITY ACCESS MODES STORAGECLASS AGE
alertmanager-rancher-monitoring-alertmanager-db-alertmanager-rancher-monitoring-alertmanager-0 Bound pvc-cea6316e-f74f-4771-870b-49edb5442819 5Gi RWO harvester-longhorn 16m -
On the Addons screen of the Harvester UI, select ⋮ (menu icon) and then select Edit YAML.

-
As indicated below, change the two occurrences of the number
50to30under prometheusSpec, and then save. Theprometheusfeature will use a 30GiB disk to store data.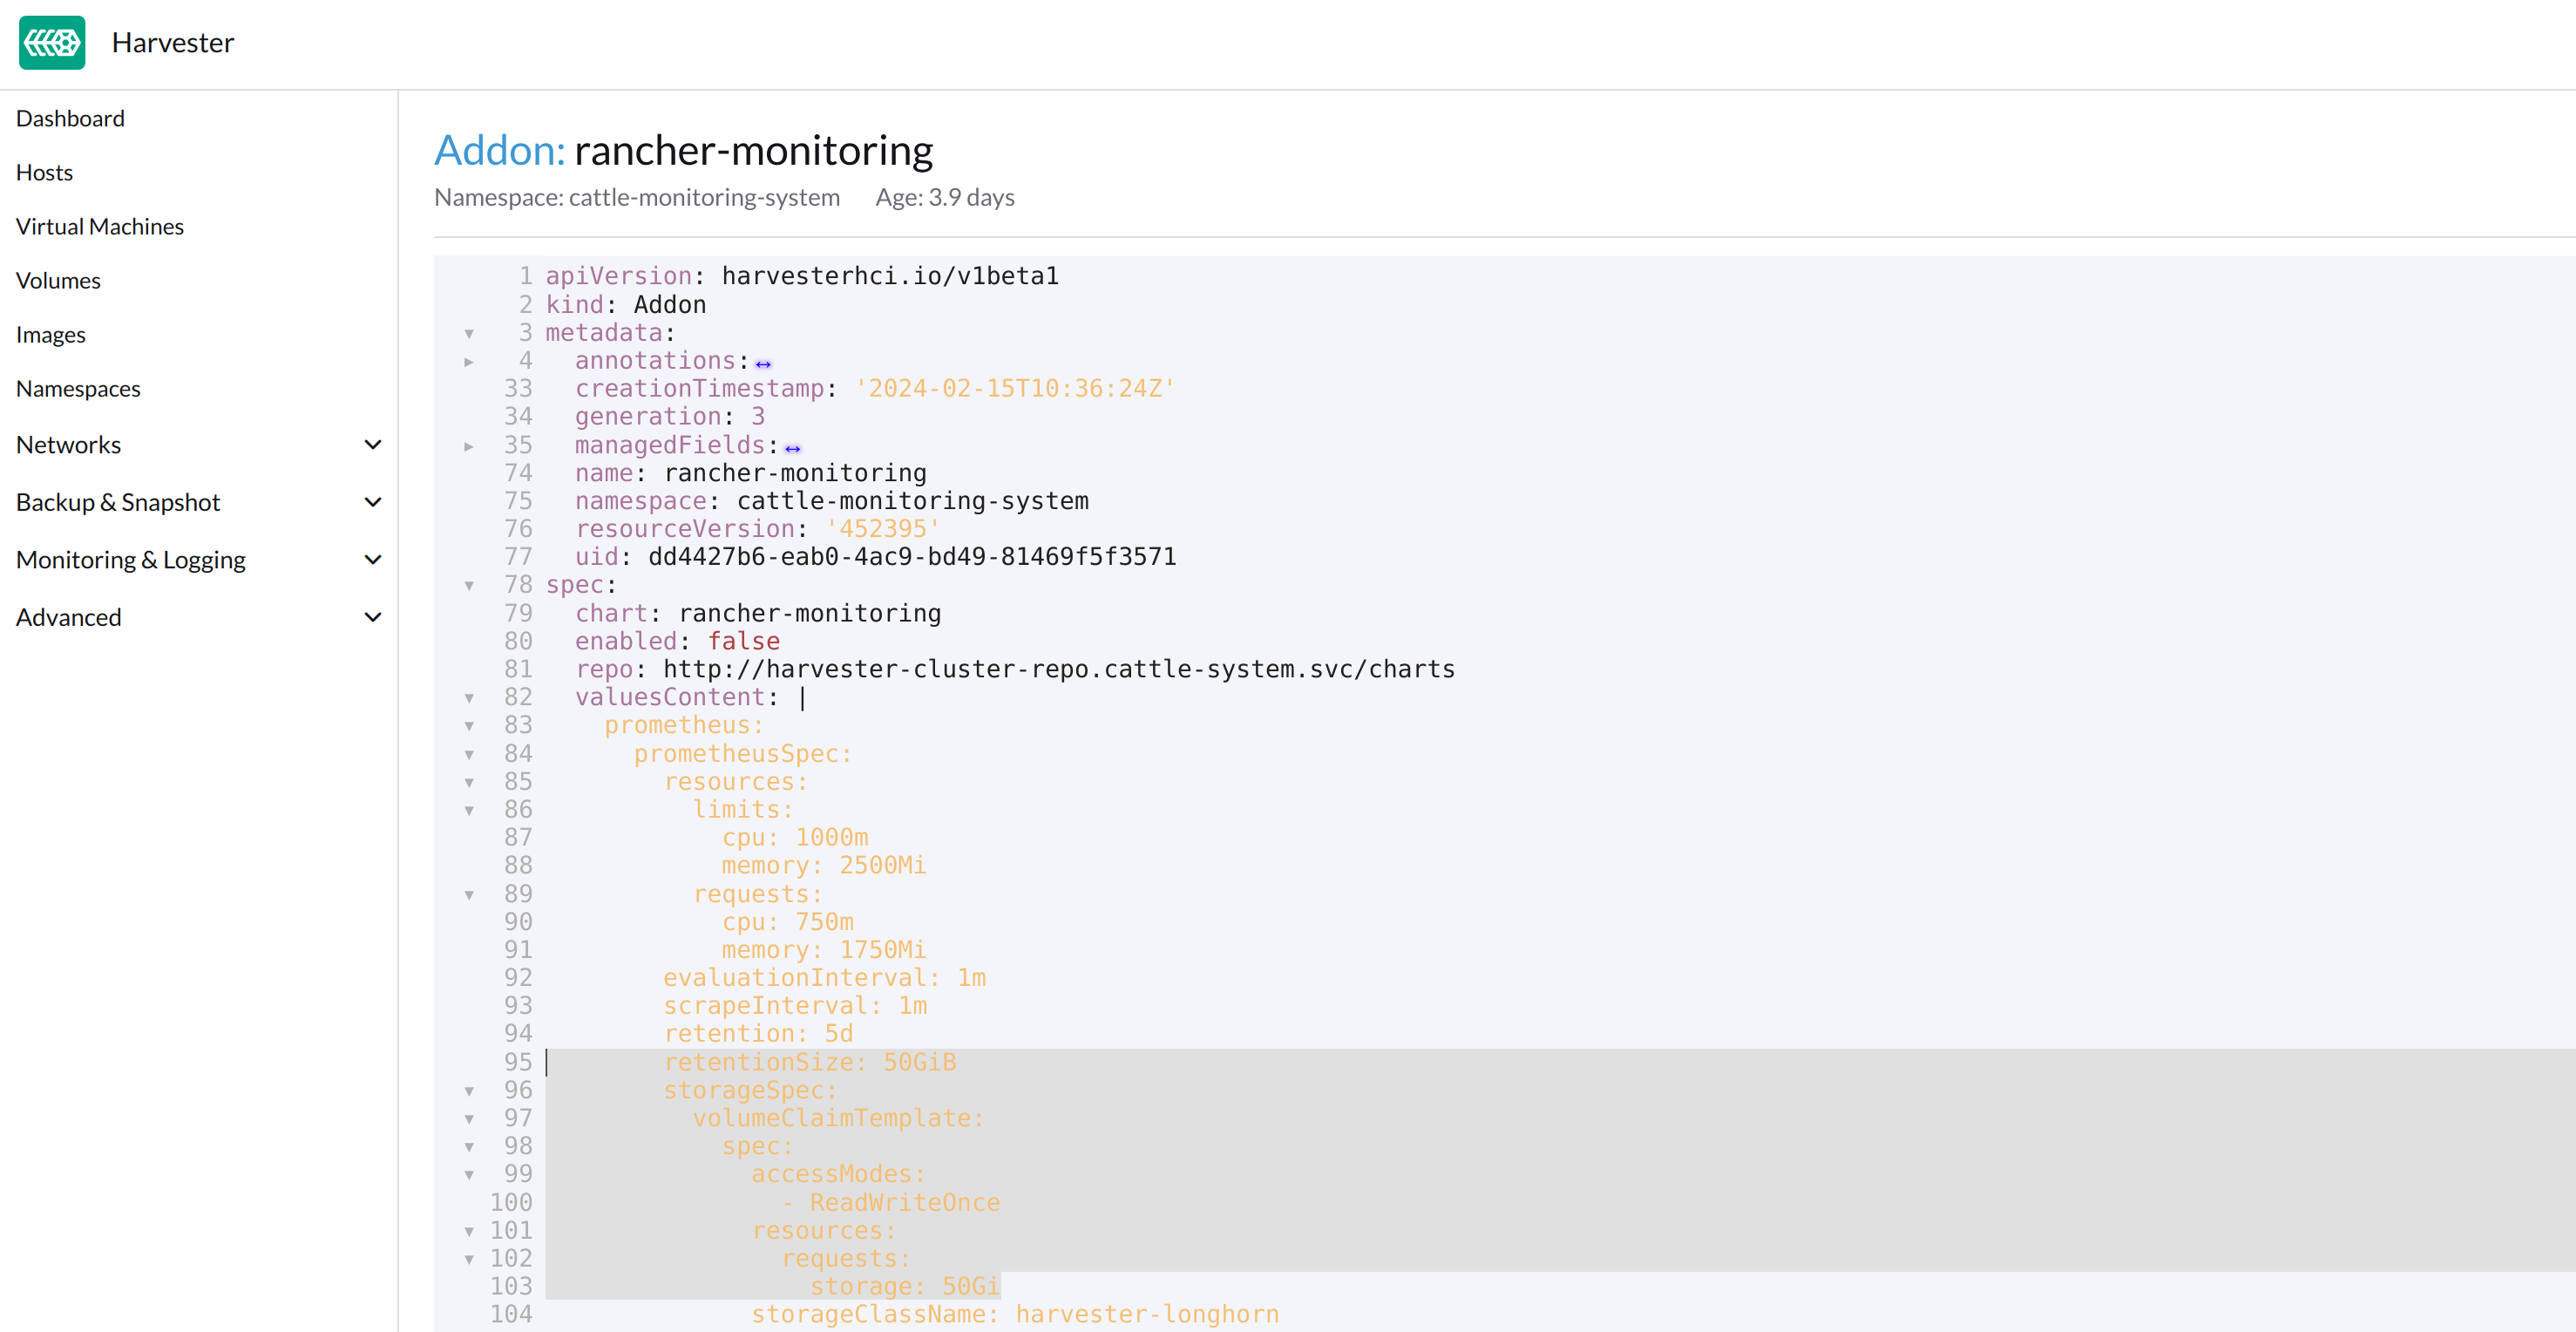
Alternatively, you can use
kubectlto edit the object.kubectl edit addons.harvesterhci.io -n cattle-monitoring-system rancher-monitoringretentionSize: 50GiB // Change 50 to 30
storageSpec:
volumeClaimTemplate:
spec:
accessModes:
- ReadWriteOnce
resources:
requests:
storage: 50Gi // Change 50 to 30
storageClassName: harvester-longhorn -
Enable the
rancher-monitoringaddon and wait for a few minutes.. -
All pods are successfully deployed, and the
rancher-monitoringfeature is available.$ kubectl get pods -n cattle-monitoring-system
NAME READY STATUS RESTARTS AGE
alertmanager-rancher-monitoring-alertmanager-0 2/2 Running 0 3m52s
helm-install-rancher-monitoring-s55tq 0/1 Completed 0 4m17s
prometheus-rancher-monitoring-prometheus-0 3/3 Running 0 3m51s
rancher-monitoring-grafana-d6f466988-hkv6f 4/4 Running 0 3m55s
rancher-monitoring-kube-state-metrics-7659b76cc4-ght8x 1/1 Running 0 3m55s
rancher-monitoring-operator-595476bc84-r96bp 1/1 Running 0 3m55s
rancher-monitoring-prometheus-adapter-55dc9ccd5d-vtssc 1/1 Running 0 3m55s
rancher-monitoring-prometheus-node-exporter-lgb88 1/1 Running 0 3m55s
rancher-monitoring-crd ManagedChart State is Modified
Issue Description
In certain situations, the state of the rancher-monitoring-crd ManagedChart object changes to Modified (with the message ...rancher-monitoring-crd-manager missing...).
Example:
$ kubectl get managedchart rancher-monitoring-crd -n fleet-local -o yaml
apiVersion: management.cattle.io/v3
kind: ManagedChart
...
spec:
  chart: rancher-monitoring-crd
  defaultNamespace: cattle-monitoring-system
  paused: false
  releaseName: rancher-monitoring-crd
  repoName: harvester-charts
  targets:
  - clusterName: local
    clusterSelector:
      matchExpressions:
      - key: provisioning.cattle.io/unmanaged-system-agent
        operator: DoesNotExist
  version: 102.0.0+up40.1.2
...
status:
  conditions:
  - lastUpdateTime: "2024-02-22T14:03:11Z"
    message: Modified(1) [Cluster fleet-local/local]; clusterrole.rbac.authorization.k8s.io
      rancher-monitoring-crd-manager missing; clusterrolebinding.rbac.authorization.k8s.io
      rancher-monitoring-crd-manager missing; configmap.v1 cattle-monitoring-system/rancher-monitoring-crd-manifest
      missing; serviceaccount.v1 cattle-monitoring-system/rancher-monitoring-crd-manager
      missing
    status: "False"
    type: Ready
  - lastUpdateTime: "2024-02-22T14:03:11Z"
    status: "True"
    type: Processed
  - lastUpdateTime: "2024-04-02T07:45:26Z"
    status: "True"
    type: Defined
  display:
    readyClusters: 0/1
    state: Modified
...
The ManagedChart object has a downstream object named Bundle, which has similar information.
Example:
$ kubectl get bundles -A
NAMESPACE     NAME                                          BUNDLEDEPLOYMENTS-READY   STATUS
fleet-local   fleet-agent-local                             1/1
fleet-local   local-managed-system-agent                    1/1
fleet-local   mcc-harvester                                 1/1
fleet-local   mcc-harvester-crd                             1/1
fleet-local   mcc-local-managed-system-upgrade-controller   1/1
fleet-local   mcc-rancher-logging-crd                       1/1
fleet-local   mcc-rancher-monitoring-crd                    0/1                       Modified(1) [Cluster fleet-local/local]; clusterrole.rbac.authorization.k8s.io rancher-monitoring-crd-manager missing; clusterrolebinding.rbac.authorization.k8s.io rancher-monitoring-crd-manager missing; configmap.v1 cattle-monitoring-system/rancher-monitoring-crd-manifest missing; serviceaccount.v1 cattle-monitoring-system/rancher-monitoring-crd-manager missing
When the issue exists and you start an upgrade, Harvester may return the following error message: admission webhook "validator.harvesterhci.io" denied the request: managed chart rancher-monitoring-crd is not ready, please wait for it to be ready.
Also, when you search for the objects marked as missing, you will find that they exist in the cluster.
Example:
$ kubectl get clusterrole rancher-monitoring-crd-manager
apiVersion: rbac.authorization.k8s.io/v1
kind: ClusterRole
metadata:
  annotations:
    meta.helm.sh/release-name: rancher-monitoring-crd
    meta.helm.sh/release-namespace: cattle-monitoring-system
  creationTimestamp: "2023-01-09T11:04:33Z"
  labels:
    app: rancher-monitoring-crd-manager
    app.kubernetes.io/managed-by: Helm
  name: rancher-monitoring-crd-manager
  ...
rules:
- apiGroups:
  - apiextensions.k8s.io
  resources:
  - customresourcedefinitions
  verbs:
  - create
  - get
  - patch
  - delete

$ kubectl get clusterrolebinding rancher-monitoring-crd-manager
apiVersion: rbac.authorization.k8s.io/v1
kind: ClusterRoleBinding
metadata:
  annotations:
    meta.helm.sh/release-name: rancher-monitoring-crd
    meta.helm.sh/release-namespace: cattle-monitoring-system
  creationTimestamp: "2023-01-09T11:04:33Z"
  labels:
    app: rancher-monitoring-crd-manager
    app.kubernetes.io/managed-by: Helm
  name: rancher-monitoring-crd-manager
  ...
roleRef:
  apiGroup: rbac.authorization.k8s.io
  kind: ClusterRole
  name: rancher-monitoring-crd-manager
subjects:
- kind: ServiceAccount
  name: rancher-monitoring-crd-manager
  namespace: cattle-monitoring-system

$ kubectl get configmap -n cattle-monitoring-system rancher-monitoring-crd-manifest
apiVersion: v1
data:
  crd-manifest.tgz.b64: ...
kind: ConfigMap
metadata:
  annotations:
    meta.helm.sh/release-name: rancher-monitoring-crd
    meta.helm.sh/release-namespace: cattle-monitoring-system
  creationTimestamp: "2023-01-09T11:04:33Z"
  labels:
    app.kubernetes.io/managed-by: Helm
  name: rancher-monitoring-crd-manifest
  namespace: cattle-monitoring-system
  ...

$ kubectl get ServiceAccount -n cattle-monitoring-system rancher-monitoring-crd-manager
apiVersion: v1
kind: ServiceAccount
metadata:
  annotations:
    meta.helm.sh/release-name: rancher-monitoring-crd
    meta.helm.sh/release-namespace: cattle-monitoring-system
  creationTimestamp: "2023-01-09T11:04:33Z"
  labels:
    app: rancher-monitoring-crd-manager
    app.kubernetes.io/managed-by: Helm
  name: rancher-monitoring-crd-manager
  namespace: cattle-monitoring-system
  ...
Root Cause
The objects that are marked as missing do not have the related annotations and labels required by the ManagedChart object.
Example:
One of the manually recreated object:

apiVersion: rbac.authorization.k8s.io/v1
kind: ClusterRole
metadata:
  annotations:
    meta.helm.sh/release-name: rancher-monitoring-crd
    meta.helm.sh/release-namespace: cattle-monitoring-system
    objectset.rio.cattle.io/id: default-mcc-rancher-monitoring-crd-cattle-fleet-local-system   # This required item is not in the above object.
  creationTimestamp: "2024-04-03T10:23:55Z"
  labels:
    app: rancher-monitoring-crd-manager
    app.kubernetes.io/managed-by: Helm
    objectset.rio.cattle.io/hash: 2da503261617e9ea2da822d2da7cdcfccad847a9    # This required item is not in the above object.
  name: rancher-monitoring-crd-manager
...
rules:
- apiGroups:
  - apiextensions.k8s.io
  resources:
  - customresourcedefinitions
  verbs:
  - create
  - get
  - patch
  - delete
  - update
Workaround
-
Patch the ClusterRole object
rancher-monitoring-crd-managerto add theupdateoperation.$ cat > patchrules.yaml << EOF
rules:
- apiGroups:
- apiextensions.k8s.io
resources:
- customresourcedefinitions
verbs:
- create
- get
- patch
- delete
- update
EOF
$ kubectl patch ClusterRole rancher-monitoring-crd-manager --patch-file ./patchrules.yaml --type merge
$ rm ./patchrules.yaml -
Patch the marked as
missingobjects to add the required annotations and labels.$ cat > patchhash.yaml << EOF
metadata:
annotations:
objectset.rio.cattle.io/id: default-mcc-rancher-monitoring-crd-cattle-fleet-local-system
labels:
objectset.rio.cattle.io/hash: 2da503261617e9ea2da822d2da7cdcfccad847a9
EOF
$ kubectl patch ClusterRole rancher-monitoring-crd-manager --patch-file ./patchhash.yaml --type merge
$ kubectl patch ClusterRoleBinding rancher-monitoring-crd-manager --patch-file ./patchhash.yaml --type merge
$ kubectl patch ServiceAccount rancher-monitoring-crd-manager -n cattle-monitoring-system --patch-file ./patchhash.yaml --type merge
$ kubectl patch ConfigMap rancher-monitoring-crd-manifest -n cattle-monitoring-system --patch-file ./patchhash.yaml --type merge
$ rm ./patchhash.yaml -
Check the
rancher-monitoring-crdManagedChart object.After a few seconds, the status of the
rancher-monitoring-crdManagedChart object changes toReady.$ kubectl get managedchart -n fleet-local rancher-monitoring-crd -oyaml
apiVersion: management.cattle.io/v3
kind: ManagedChart
metadata:
...
name: rancher-monitoring-crd
namespace: fleet-local
...
status:
conditions:
- lastUpdateTime: "2024-04-22T21:41:44Z"
status: "True"
type: Ready
...Also, error indicators are no longer displayed for the downstream objects.
$ kubectl bundle -A
NAMESPACE     NAME                                          BUNDLEDEPLOYMENTS-READY   STATUS
fleet-local   fleet-agent-local                             1/1
fleet-local   local-managed-system-agent                    1/1
fleet-local   mcc-harvester                                 1/1
fleet-local   mcc-harvester-crd                             1/1
fleet-local   mcc-local-managed-system-upgrade-controller   1/1
fleet-local   mcc-rancher-logging-crd                       1/1
fleet-local mcc-rancher-monitoring-crd 1/1 -
(Optional) Retry the upgrade (if previously unsuccessful because of this issue).
Related Issue
https://github.com/harvester/harvester/issues/5505
Some rancher-monitoring Add-On Pods Are Abruptly Terminated
Issue Description
When the rancher-monitoring add-on is enabled, pods related to Prometheus, Alertmanager, and Grafana are terminated shortly after they are created.
Example:
$ kubectl -n cattle-monitoring-system get pods,svc,ep,deploy,pvc,sts,prometheus,alertmanager | grep -E 'stateful|deploy'

deployment.apps/rancher-monitoring-grafana              0/0     0            0           7h52m
deployment.apps/rancher-monitoring-kube-state-metrics   1/1     1            1           7h52m
deployment.apps/rancher-monitoring-operator             1/1     1            1           7h52m
deployment.apps/rancher-monitoring-prometheus-adapter   1/1     1            1           7h52m
statefulset.apps/alertmanager-rancher-monitoring-alertmanager   0/0     7h52m
statefulset.apps/prometheus-rancher-monitoring-prometheus       0/0     7h52m
The prometheus pod logs contain the message level=warn msg="Received SIGTERM, exiting gracefully...".
log from prometheus pod:

...
ts=2025-05-20T05:41:02.847Z caller=kubernetes.go:327 level=info component="discovery manager notify" discovery=kubernetes config=config-0 msg="Using pod service account via in-cluster config"
ts=2025-05-20T05:41:02.880Z caller=main.go:1261 level=info msg="Completed loading of configuration file" filename=/etc/prometheus/config_out/prometheus.env.yaml totalDuration=35.457401ms db_storage=998ns remote_storage=1.45µs web_handler=392ns query_engine=1.095µs scrape=34.384µs scrape_sd=515.81µs notify=10.226µs notify_sd=82.314µs rules=32.514863ms tracing=2.344µs
ts=2025-05-20T05:41:50.044Z caller=main.go:854 level=warn msg="Received SIGTERM, exiting gracefully..."
ts=2025-05-20T05:41:50.044Z caller=main.go:878 level=info msg="Stopping scrape discovery manager..."
ts=2025-05-20T05:41:50.044Z caller=main.go:892 level=info msg="Stopping notify discovery manager..."
...
The prometheus CRD object includes the storage-network.settings.harvesterhci.io/replica: "1" annotation.
- apiVersion: monitoring.coreos.com/v1
  kind: Prometheus
  metadata:
    annotations:
      meta.helm.sh/release-name: rancher-monitoring
      meta.helm.sh/release-namespace: cattle-monitoring-system
      storage-network.settings.harvesterhci.io/replica: "1"
    creationTimestamp: "2025-05-20T06:40:25Z"
The Harvester pod logs ('harvester-system/harvester' deployment) indicate that the attempt to change the storage-network setting was blocked.
...
2025-05-20T08:13:49.842448311Z time="2025-05-20T08:13:49Z" level=info msg="storage network change: {\"vlan\":955,\"clusterNetwork\":\"k8s-storage\",\"range\":\"198.18.2.0/24\"}"
2025-05-20T08:13:49.842476305Z time="2025-05-20T08:13:49Z" level=info msg="rancher monitoring not found. skip"
2025-05-20T08:13:49.842479072Z time="2025-05-20T08:13:49Z" level=info msg="current Grafana replicas: 0"
2025-05-20T08:13:49.842480501Z time="2025-05-20T08:13:49Z" level=info msg="VM import controller no found. skip"
2025-05-20T08:13:49.851381877Z time="2025-05-20T08:13:49Z" level=error msg="error syncing 'storage-network': handler harvester-storage-network-controller: Waiting for all volumes detached: pvc-6f66d234-f9c2-453e-8c17-383d9b489956,pvc-07c626f5-5135-4783-952d-cc20b1607cb5,pvc-1cfd6efe-c928-42e5-a834-8c27ed0e4897,pvc-5ce98d0a-5da1-4f30-af14-a8de29233380,pvc-1c9b7c9a-4943-4462-9082-217f9988cfc5,pvc-e9d92bfd-63c7-4ae3-ba00-1ce209f12caa,pvc-205ba31d-35fb-44f6-a3c4-c53001ec0dd6,pvc-6b5a7d11-7578-4397-9e13-ab475fe91463,pvc-669c69dd-93ad-4304-a340-484f7108362b,pvc-7668c486-b688-4524-b359-0cf9ec21cbc0,pvc-7d294996-821f-4434-ae4f-55a6de67f28c,pvc-216333c6-73f9-4e68-ac8b-53ab95a1f138,pvc-f72ca889-70c9-4dd9-bcec-a17ab65a1df4,pvc-01895fab-12f8-452a-9161-7d3c01e22726,pvc-330caa2d-5fdc-42f2-8c53-c5f80044760f,pvc-9506b7d0-c2d5-41f2-a08b-d7bc22dddb88,pvc-3e2b46d4-c471-44a9-9765-64babdb6ceed,pvc-25fe3372-1802-46d5-abf1-039099c567e2,pvc-b16fb262-cb38-4438-b074-84c7ad080a15,pvc-757c0f22-4ed6-4669-844d-cd7a87ceb26e,pvc-e0d99d8f-581f-4be6-baa3-d345308c9330,pvc-f5e1e19d-3dfb-4be1-9354-c092d7f03009,pvc-383ec26a-51f6-4f9d-8d8a-179651846d92,pvc-0d8f5737-c6e4-4f55-8d19-cf7a785552fc,pvc-5091892e-faf2-47b1-b987-bbde1ab2c13a,pvc-6f0c97ae-dfda-4799-bf26-e85feace5414,pvc-b0f717af-8a79-4c4e-b82e-90dedeae7697,pvc-ffe982d5-5ff1-40aa-a0db-cc10360d2d89,pvc-370757e2-4bce-41e7-b6f7-95aa8a5e8cf1,pvc-5a77d3e3-d555-476c-840f-7b9dadeb7478,pvc-43987c88-99b1-4889-9a47-5261717fe265,pvc-9f675704-9c52-46c2-96bf-2ff83d805383,pvc-d0b4e1d0-9bcd-4a8a-b52c-e1d8062a8099,pvc-a29be31f-531f-409a-bf5a-d267a54e2edb, requeuing"
...
Root Cause
When you make changes to the storage-network setting, the Harvester controller waits for the attached volumes to be detached before applying the changes. In addition, the controller automatically terminates the pods related to Prometheus, Alertmanager, and Grafana because those pods use volumes to store data.
This process usually takes a short time to complete, but can be disrupted when the following occur:
- Attached volumes prevent the Harvester controller from applying the changes to the setting.
- A user or the
monitoring-operatorattempts to enable therancher-monitoringadd-on. - The Harvester controller terminates the pods.
Workaround
-
Disable the
rancher-monitoringadd-on. -
Check if the storage-network setting is enabled or disabled.
-
Check for error indicators in the Harvester pod logs. If volumes are still attached, stop the related virtual machines until no errors appear after the
storage network changemessage. -
Enable the
rancher-monitoringadd-on.